Dow Jones Decline, Tech Stocks Rally, and Cryptocurrency Surge Amidst Economic Data Anticipation | Daily Market Analysis

Key events:
- Eurozone – ECB President Lagarde Speaks
- USA – S&P Global Services PMI (Oct)
The Dow Jones Industrial Average declined on Monday due to fluctuating Treasury yields and a surge in technology stocks, which partially offset losses in the energy and financial sectors. This decline occurred ahead of a busy week for corporate earnings.
The Dow Jones Industrial Average dropped by 0.6% or 190 points, while the Nasdaq saw a 0.3% increase, and the S&P 500 experienced a 0.1% decrease.
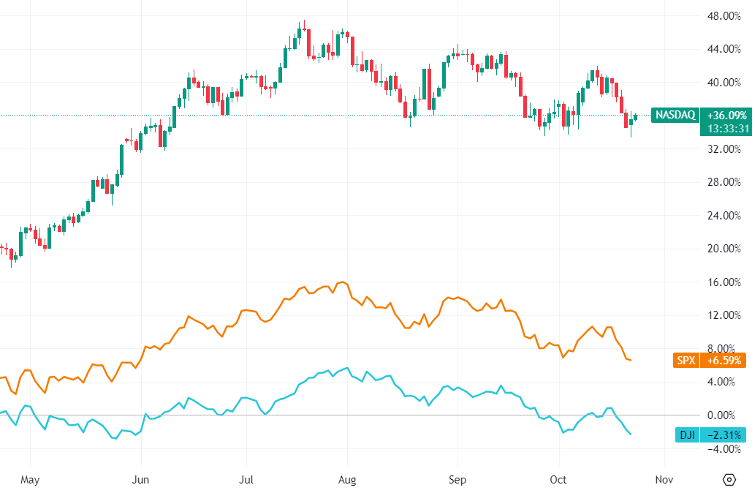
Treasury yields retreated from recent multi-year highs, with the 10-year Treasury yield falling to 4.854% after reaching a 16-year high of 5.025%.
The rise in longer-term Treasury yields can be attributed to several factors, including robust economic growth, persistent inflation, and increased borrowing by the US Treasury.
This move occurred just over a week before the Federal Open Market Committee's two-day meeting scheduled for October 31, where it is expected that the Federal Reserve will maintain current interest rates.
Tech stocks started the week positively as investors anticipated significant tech company earnings reports, including Microsoft Corporation (NASDAQ: MSFT) and Alphabet (NASDAQ: GOOGL), which are set to announce their results for the September quarter on Tuesday.
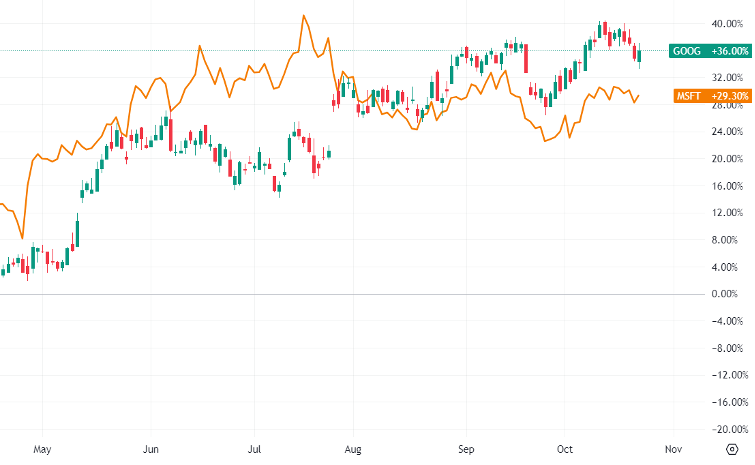
Despite new regulatory concerns, Alphabet saw gains after the Japanese Federal Trade Commission initiated an investigation into potential antitrust violations related to ad-revenue sharing with Android phone manufacturers. The investigation is focused on whether Alphabet favored its apps, such as its search engine, over rival apps.
Meta Platforms (NASDAQ: META), International Business Machines (NYSE: IBM), Amazon (NASDAQ: AMZN), and Intel (NASDAQ: INTC) are scheduled to report their results on Wednesday and Thursday.
Chevron Corp (NYSE: CVX) experienced a decline of more than 3%, negatively impacting the broader energy sector, after announcing a $53 billion agreement to acquire Hess Corporation (NYSE: HES). This acquisition is expected to enhance Chevron's assets in Guyana and boost its overall oil and gas production.
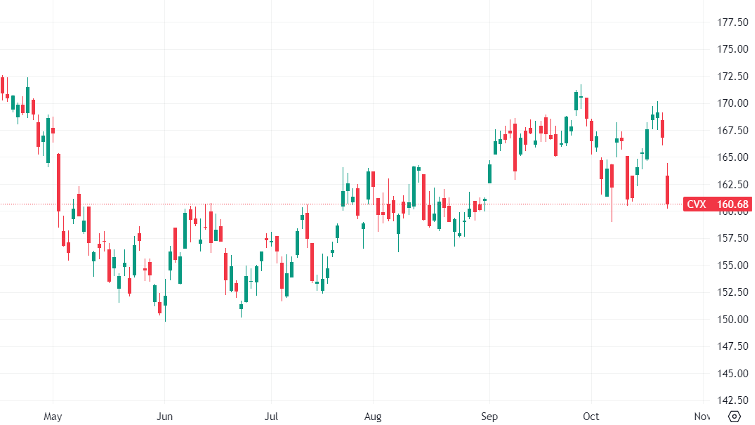
Additionally, a 2% drop in oil prices contributed to downward pressure on sentiment regarding energy stocks, despite ongoing concerns about potential oil supply disruptions amid the Israel-Hamas conflict.
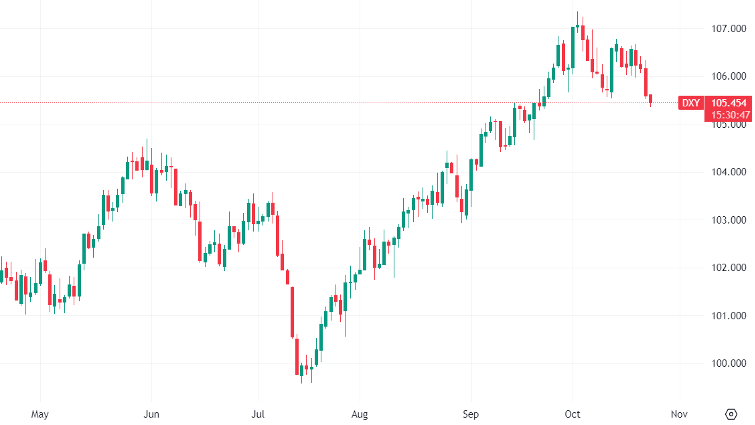
The dollar weakened against a basket of currencies on Tuesday, reflecting a decline in Treasury yields as investors awaited significant US economic data ahead of the Federal Reserve's monetary policy meeting next week. The dollar index was recently situated at approximately 105.47, having dropped more than 0.5% in the prior session and reaching its lowest point in about a month due to falling US Treasury yields.
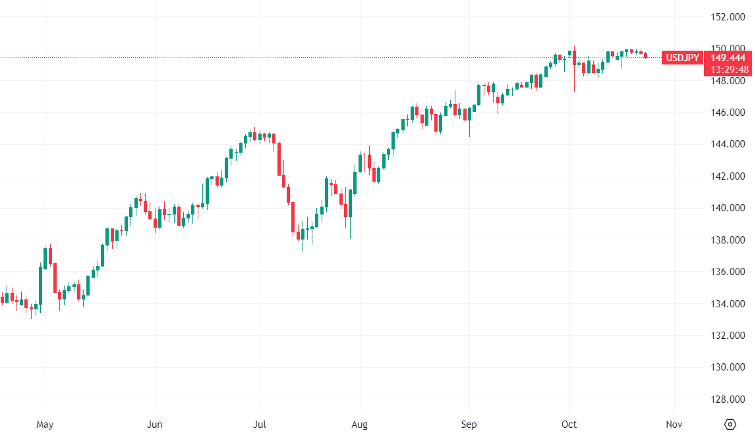
Simultaneously, the dollar's retreat offered some relief to the beleaguered yen, with the Japanese currency hovering near 149.65 after briefly breaching the sensitive 150-level on both Friday and Monday.
Market observers view the 150 level as a potential trigger for Japanese authorities to intervene in the currency market. However, strong US data this week could push the yen back toward the danger zone.
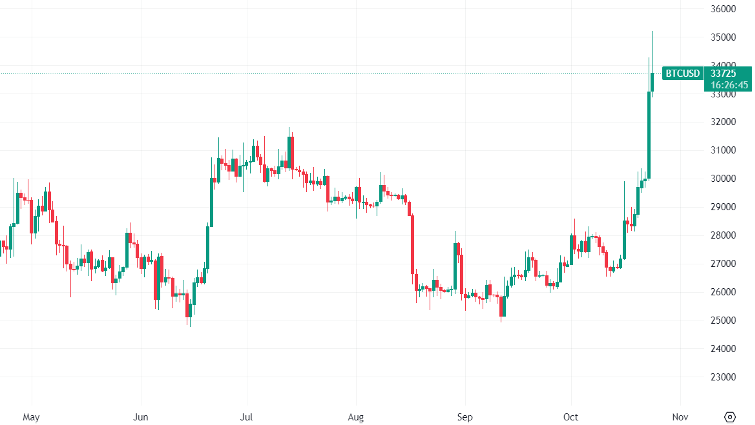
In the cryptocurrency markets, Bitcoin continued its ascent during Asian trading hours, reaching $35,198, its highest level since May 2022.
This momentum gained further traction when a judge ruled that the US Securities and Exchange Commission had no legal grounds to reject Grayscale's plan to convert its GBTC bitcoin fund into an ETF.
Gold is in a consolidation phase just below a new five-month high on Monday, following a substantial upward trend that encountered resistance near the psychological barrier of $2,000.
The rejection at the $2,000 level on Friday suggests increased challenges in surpassing this price zone, which serves as a significant obstacle. Consequently, traders are taking profits after a remarkable 7% rally over the past two weeks.
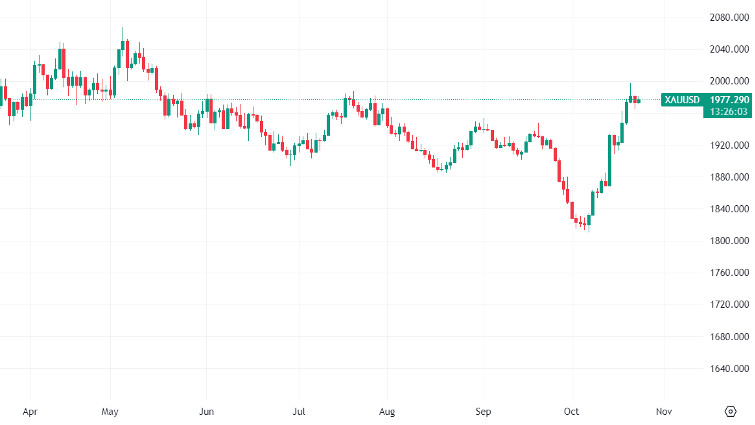
Additionally, overextended daily indicators contribute to the current pause. However, the retracement has been modest so far, indicating that bullish sentiment remains intact for a renewed attempt to breach the $2,000 mark.
Unrest in the Middle East has driven traders to seek safety amid concerns of escalating conflicts, leading to heightened demand for the safe-haven asset of gold and contributing to its ongoing price increase.

Related Articles
Latest updates
Latest updates


Technical Analysis
Latest updates


