Is the Any Correlation Between Treasuries and Stocks? | Daily Market Analysis
Key events:
- UK – Christmas
- Australia – Christmas
- New Zealand – Christmas
- Canada – Boxing Day
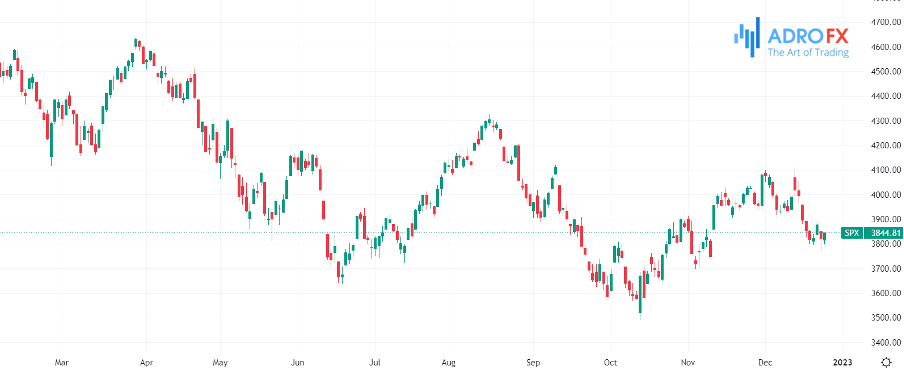
An important market phenomenon affecting both short- and long-term investors in 2022 was the unfortunate consistency in the dynamics between the S&P 500 and U.S. Treasuries.
In the past, having bonds in an investor's portfolio, mainly zero-default-risk Treasury notes and "long bonds," usually helped them guard against volatility in stocks.
This was not the case in 2022, as stocks often fell when interest rates rose. High CPI values, hawkish Fed statements, stubbornly high consumer spending, and nominal wages have caused the debt market to rattle time after time.
But lately, treasuries have started to provide investors with an occasional respite from the volatility and bearish dynamics of stocks. Will this trend continue?
While some experts expect a new environment for stocks/bonds, others believe the focus of traders will shift from inflation to recession as we head into 2023, providing a negative correlation between the two asset classes.
Judging by the weak manufacturing sector data, the rapidly deteriorating employment picture, and moderate 3-month annualized inflation estimates, the Fed may not be able to provide a "soft landing" for the economy. Instead, we are likely to see periods of slight contraction in economic activity in 2023.
This will probably mean that lower interest rates and cyclical macro rates will prevail over fears of inflation. The divergence in the dynamics of treasuries and stocks will be a positive thing, especially since yields are much higher now than they were a year ago.
Here we can reassure investors who are still trying to diversify their investments: next year should be less difficult if the close positive correlation between stocks and bonds continues to weaken.
We have yet to find out whether the current investment climate is more in line with what was seen between 1945 and 1995 when stocks and bonds moved in unison. That period was generally characterized by a higher rate of growth in economic activity with sustained inflation.
Then from the late 1990s through the risk pandemic, deflation rather than uncomfortably high inflation was the trend that encouraged the benefits of diversification, with investors allocating their funds between equities and Treasury securities with long maturities.
When it comes to the iShares US Treasury Bond ETF exchange-traded fund chart, there's still a lot of work to be done. There's no upward trend to speak of.
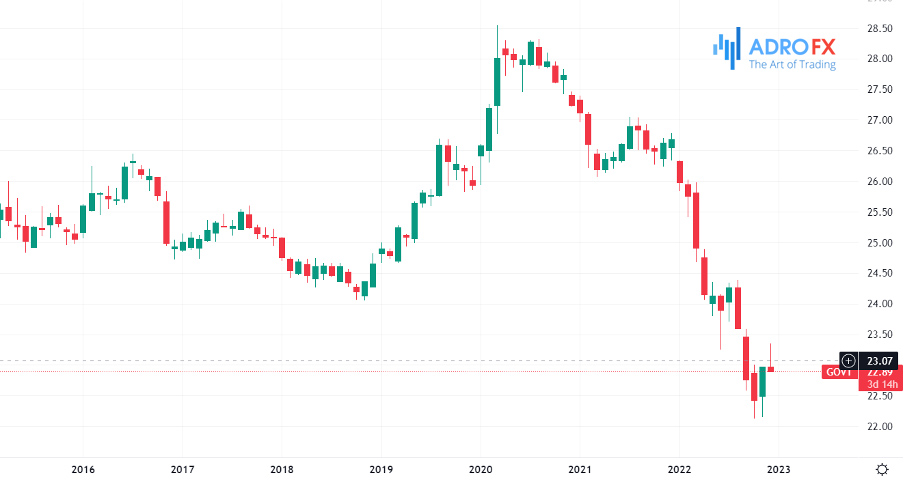
Moreover, earlier this month, the bulls failed in the $23.25-$23.35 range. We would like to see the GOVT move back above that peak of two weeks ago and retrace the 200-day Moving Average.
Many strategic analysts at brokerage firms and investment banks continue to argue that the 60/40 allocation strategy remains irrelevant, but it seems like diversification will work better in 2023 given the higher initial yields on treasuries, lower inflation risks, and heightened concerns about economic growth.

Related Articles


Latest updates
Latest updates


Technical Analysis
Latest updates


