What is the Elliott Wave Forex Theory

Every trader understands that changes in the rate of financial assets can bring good profits as well as serious losses. That is why the ability to predict the future movements of the market, which allows for making the right trading decisions, is so valued.
Technical analysis instruments, which help to identify the patterns on charts, assist in this. One of the most effective methods is the Elliott Waves based on the study of crowd psychology, the essence of which we will consider in this article.
What is Elliott Waves Theory
Elliott Waves is a popular method of technical analysis that allows traders to follow recurring trends on charts and make forecasts about future movements of exchange-traded assets. This method is based on the theory that market trends follow patterns that reflect the psychology of crowd behavior.
The bases of the wave theory were formulated in the 1930s by American financier Ralph Elliott.
All in all, he singled out 13 wave models which were regularly traced on the charts he studied. In this case, it was exclusively about the repeatability of the form, but not the amplitude or time intervals. The mathematical basis of the theory was the sequence of Fibonacci numbers, and its brief description was originally published in an 18-page pamphlet entitled "The Wave Principle".
For several decades, no one paid much attention to Elliott waves and did not apply them in practice. Only in the 70s and '70s did this method of technical analysis become widespread among traders due to the efforts invested in the development and popularization of the wave theory by Robert Prechter and Alfred Frost.
Initially, this tool of technical analysis was focused exclusively on the stock market but later began to be applied to trade almost any stock assets, including now popular cryptocurrencies.
The Basic Rules of the Elliott Waves
In theory, any more or less experienced trader can by eye distinguish the trends of 5 and 3 waves on the chart. The main problem is the subjectivity of the analysis of the existing structure since each observer has different waves by size, slope angle, etc.
To smooth this aspect, Elliott, and later the theorists who followed his lead, have created some rules which help to identify the basic pattern of waves on a chart:
The second wave should not end below the initial mark of the first wave.
The fourth wave cannot enter the price territory of the second wave.
The third wave must end above the extreme mark of the first wave. In addition, it cannot be the shortest among the three motive waves. More often than not, it is the longest of them.
The fifth wave must end higher than the third wave.
The rollback in the 8-wave structure cannot consist of more than 3 waves - only ABC, no DE, etc. (but in other models this is acceptable).
In an upward movement, one of the three driving waves should exceed the length of the other two.
The end of the ABC corrective cycle should fall approximately at the end of wave 4 or just below it.
Unlike motive movements, which always consist of 5 waves forming approximately similar figures, the corrective movements can be lined up in markedly different form structures and contain more than three waves.
Consider the most famous patterns of corrective waves:
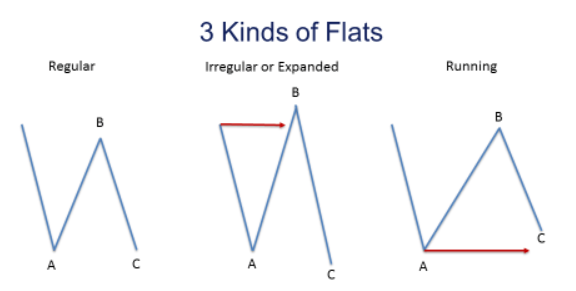
Flat - the ABC corrective waves move in a sideways channel formed from two conditional horizontal lines. The length of the waves is either approximately the same, or B is longer than A and C. If the channel in which the correction takes place is not horizontal, but inclined (against the impulse movement), a "flag" pattern is formed, which hints at the continuation of the trend.
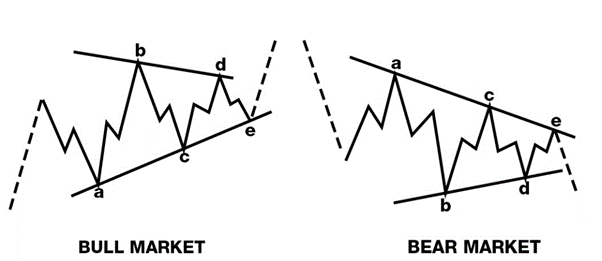
A triangle is a corrective pattern of 5 waves (ABCDE) moving in an inclined narrowing channel directed against the motive trend. Usually, such figures are the penultimate movement in the forming structure, and the exit from them occurs in the direction of the previous movement.
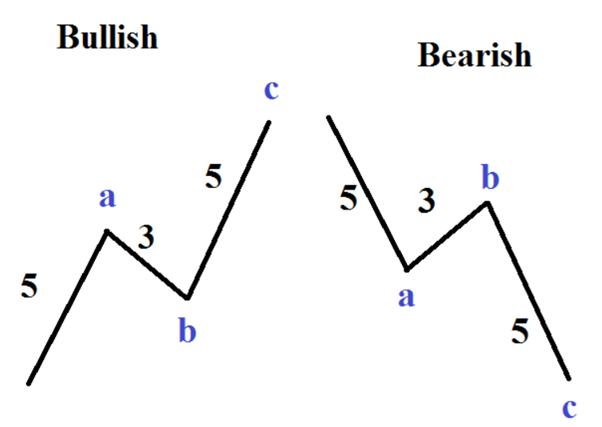
Zigzag - the correction occurs in the form of a zigzag at a steep angle to the motive trend. Wave B is usually shorter than the other two waves, and wave C can reach 150-250% of the length of A. The steeper the pullback (B), the more likely it is that C will be elongated.
In many cases the zigzag correction takes part in forming a "Head and Shoulders" pattern on the chart, forming the right shoulder. Waves 3, 4, and 5 of the motive movement are responsible for the left shoulder.
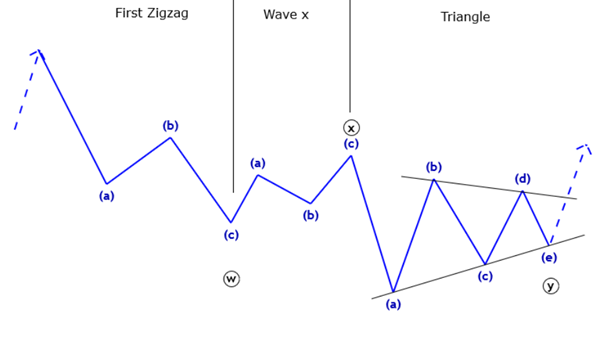
Complex - consists of several of the above-mentioned types of wave corrections. If the combination is double, its waves are denoted by the symbols W, X, and Y. If the corrective structure is triple, then W, X, Y, XX, and Z.
Can I Use Indicators with Elliott Wave Theory?
To better identify Elliott Wave Patterns on a chart, auxiliary indicators can be used. For example, a Moving Average (MA) often helps to identify the end of a retracement movement, as it acts as dynamic support or resistance.
This indicator works best in a 4-hour time frame with a period of 30.
The MA 250, 200, and 150 also perform well in the 1-hour time frame.
Oscillators are another popular type of indicator used in conjunction with Elliott Wave Theory. They track convergence and divergence, confirming the completion of motive formation. As an option, it may be the MACD indicator, but there is also the Elliott Wave Oscillator which is specially tuned for working with waves.
On it, the highest peak always corresponds to the end of the third wave in an ascending movement. And when the histogram goes from the negative to the positive area, it signals the completion or the beginning of a new cycle. There is often convergence between the third and the fifth wave in this oscillator.
Practical Application
When the Elliott Wave Theory is used to find entry points into trading positions, the most obvious signal is the formation of a motive movement from the point where the trend reverses.
If it is an uptrend, the entry into the position is made in one of the three impulse waves.
It is best to wait for the first impulse wave to complete, and then open a trade on the trend.
Two methods can be used in this case:
Conservative - a long position is opened after the corrective movement is completed at the level of the end of wave 5. Through the beginning of the first and the end of the second wave, a signal line is drawn, in case of return of the rate to which the transaction is closed. The repeated opening is made on top of a new maximum after the correction of the signal line.
Moderate - initial conditions for placing an order are similar to the conservative method, but the buy order is placed at the level of the end of wave B. Further actions are similar - if necessary, the trade is closed, and the signal line is corrected.
The aggressive method of entering a position consisting in opening a position after the signal line breakdown is also used sometimes. Such an event is considered to indicate the beginning of a new impulse model formation.
Elliott Waves Trading Strategy
Wave analysis is mainly used by professional traders in trading. Beginners prefer a simpler strategy, and that is why. Pretty simple and straightforward wave analysis is very difficult to apply in practice, because it is quite difficult to discern on a real chart, in real-time, which stage of the cycle the market is in. Learning to trade by this strategy is worthy only if you are serious about trading on the market. It is best to combine this strategy with some indicators.
For example:
- MACD;
- Moving Averages;
- Fibonacci Retracement.
In our opinion, a good synergistic effect can be felt by combining the wave analysis with the Fibonacci grid and extension.
In general, the theory discussed in this lesson is in line with Fibonacci numbers. The strategy we will tell you about below is quite popular and many use it as an example.
To begin with, we need to find the growing momentum without strong corrections after the fall.
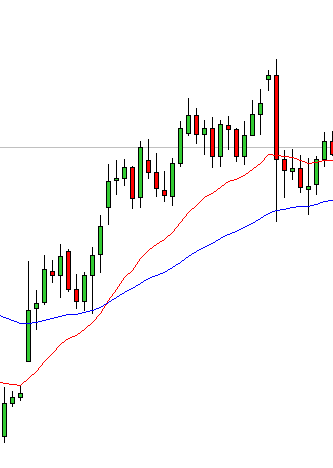
Then we need to stretch the Fibonacci grid and wait for a correction to one of the levels.
A trade can be opened after the price hits one of the levels or after a bullish candle is formed and closes (after the price rebounds from the level).
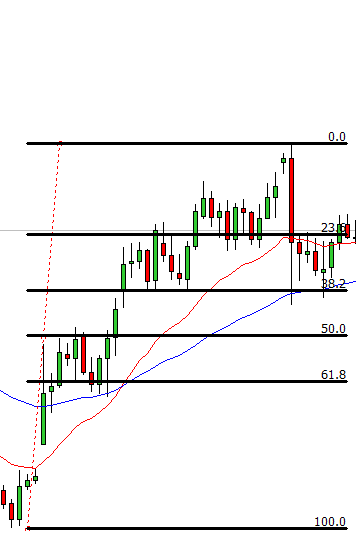
In our case, the price rebounded precisely from level 50. The trade should have been opened from this level. More conservative and risk-averse traders can open a position when the maximum of the first wave. Stop-Loss is set behind the minimum of the second wave.
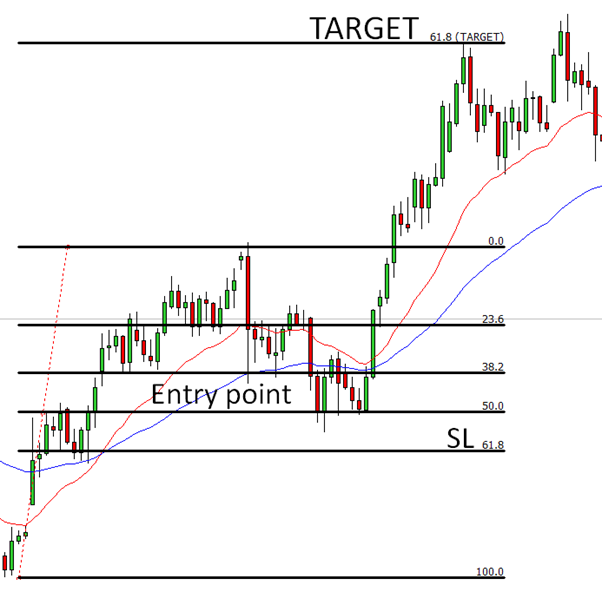
Then we face the question: how long to keep the open trade? It is necessary to wait for the moment when during the formation of the fifth wave, the price reaches the peak of the third wave. We advise to go out in parts, near important levels, which can be identified, but about this too, another time.
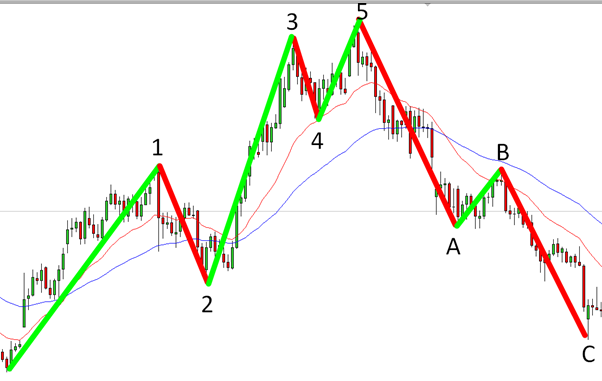
Now mark all of the waves.
Disadvantages of the Elliott Wave Theory
Even though Elliott waves are widely used in technical analysis, they are a theoretical tool rather than an independent trading indicator.
Even Robert Prechter, who gave a second life to the wave theory, said that it was just a method for confirmation of the cyclic behavior of markets, but not a forecasting method.
Elliott Waves are often criticized for their subjectivity because every single observer can see formations on a chart in his way. Consequently, a forecast of future changes in the price of an exchange-traded asset may not come true due to the initial incorrect visualization of the wave patterns.
Some believe that Elliott waves are quite easy to draw on already established charts, but it is impossible to uniquely identify the boundaries of the waves when trying to predict the unformed model to the end. This makes the successful use of this theory in practice practically impossible, particularly in terms of selecting points for entering and exiting positions.
Some believe that the application of the wave theory leads to losses rather than profits more often because it contains a lot of nuances that even experienced traders are not able to take into account to the full extent.
Another drawback of the Elliott Wave Theory is the necessity of its long study before it can be successfully applied in trading.
Unlike most popular indicators, Elliott Waves cannot be learned in a few hours or days. According to reviews of traders who have studied this technique, it can take months or even years to fully master it.
Taking into account the aforementioned points, we can conclude that the wave theory can be used for trading, but only in conjunction with other instruments of technical analysis. Well, if we are talking about novice traders, they should only look for simple and unambiguous indicators.
Conclusion
In general, the entire theory of the construction of each of the Elliott Waves is quite logical and has been used for quite a long time. Even though it was developed for the stock market, it is also successfully applied to the currency market. Robert Prechter- one of the main current ideologists and followers of Elliott himself - states that modern marginal markets with automated trading systems do not influence the models` working capacity at all, but only shift statistical data towards more volatile structures. Nevertheless, despite rather strict rules used to build Elliott Waves, there is always some variability of markup, and it will be correct or not only after the structure is formed, but experience and long-term observation of prices with attempts to analyze and predict future events are also very important here.
About AdroFx
Established in 2018, AdroFx is known for its high technology and its ability to deliver high-quality brokerage services in more than 200 countries around the world. AdroFx makes every effort to keep its customers satisfied and to meet all the trading needs of any trader. With the five types of trading accounts, we have all it takes to fit any traders` needs and styles. The company provides access to 115+ trading instruments, including currencies, metals, stocks, and cryptocurrencies, which make it possible to make the most out of trading on the financial markets. Considering all of the above, AdroFx is the perfect variant for anyone who doesn't settle for less than the best.
Related Articles


Latest updates
Latest updates


Technical Analysis
Latest updates


