Wall Street Sees Modest Gains Amid Tesla Surge and Resilient Bank Shares, Setting the Tone for Q3 | Daily Market Analysis

Key events:
- USA - United States - Independence Day
- Australia - RBA Interest Rate Decision (Jul)
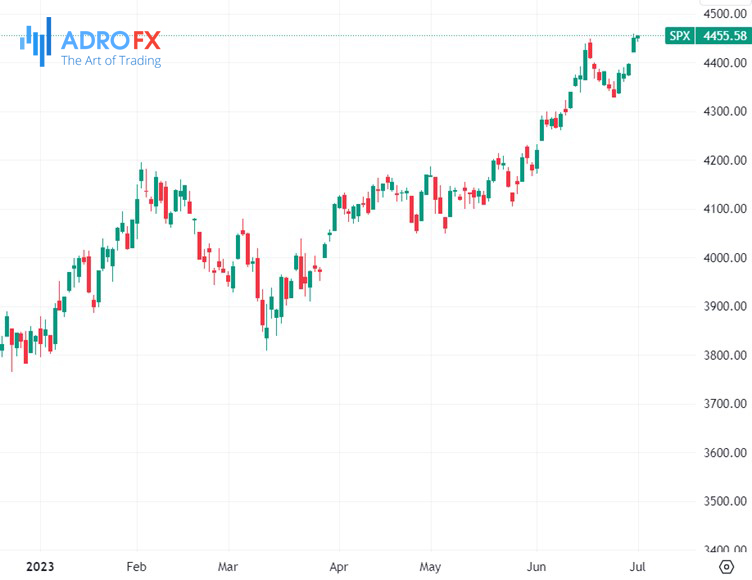
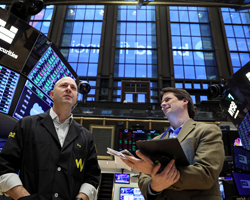
In a shortened session on Monday, Wall Street's primary indices eked out modest gains, supported by a surge in Tesla (NASDAQ: TSLA) and the resilience of bank shares, setting a subdued tone for the start of the second half of the year.
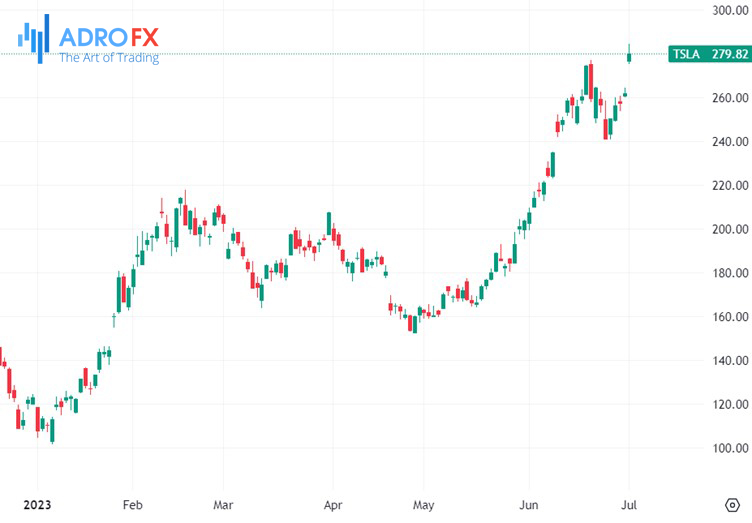
Tesla shares experienced a notable increase of 6.9% after the electric vehicle manufacturer announced a record-breaking number of vehicle deliveries during the second quarter.
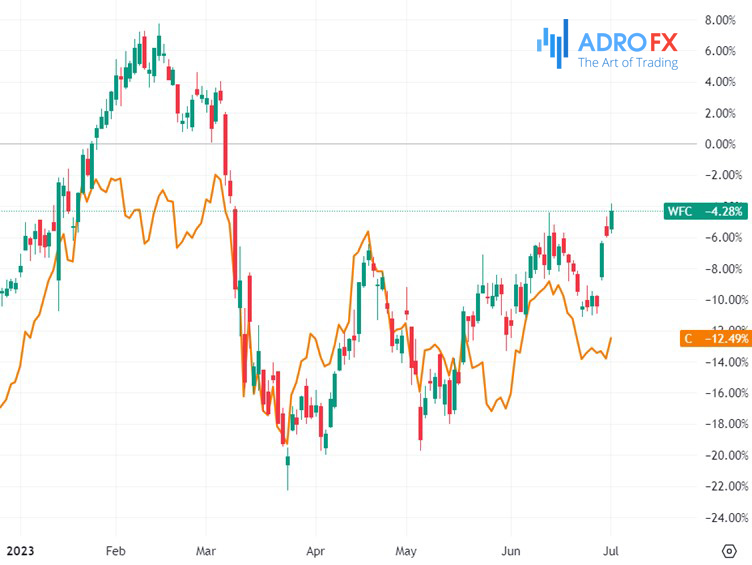
Major banks also saw their shares rise as they successfully navigated the Federal Reserve's annual health assessment and subsequently raised their dividends. Wells Fargo (NYSE: WFC) witnessed a 1.7% increase in share value, Citigroup (NYSE: C) climbed by 1.5%, and the S&P 500 banks index closed with a 1.5% gain.
Trading volumes remained lower than average as the stock market closed at 1 p.m. ET in anticipation of the Independence Day holiday on Tuesday, July 4th.
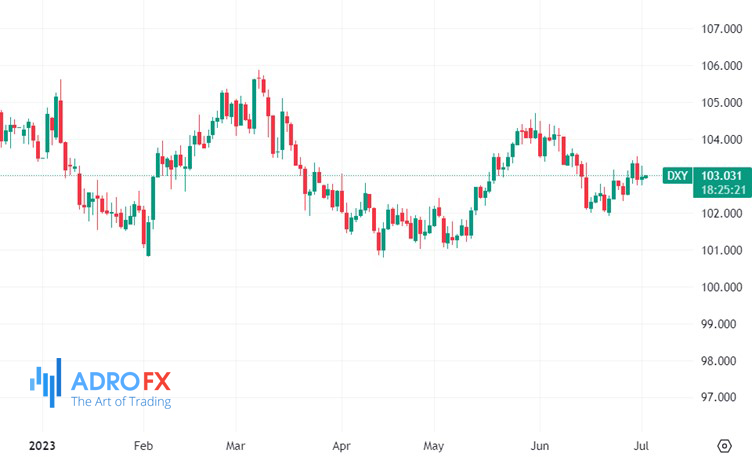
Following yesterday's release of weaker-than-expected US ISM data, market participants are eagerly awaiting the US Nonfarm Payrolls (NFP) and unemployment data on Friday.
This anticipation suggests that the US dollar could experience heightened volatility throughout the week. Currently, the Dollar Index is trading lower, but it has the potential to test the 104 level in the near future. The Euro, on the other hand, is expected to continue trading within the range of 1.08 to 1.10.
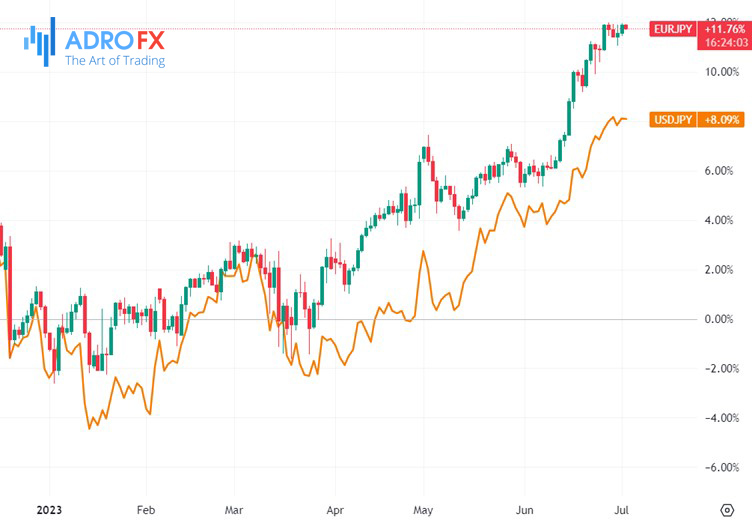
As for the EUR/JPY pair, a breakthrough above 158 is necessary to avoid a sideways range, while USD/JPY could decline to 144 if it remains below 145.
Gold has faced challenges in recent weeks due to persistent inflation, strong economic data, and the resulting expectations of higher interest rates. Although there has been a minor recovery in the past few sessions, with the price briefly dipping below $1,900, the overall trend remains bearish.
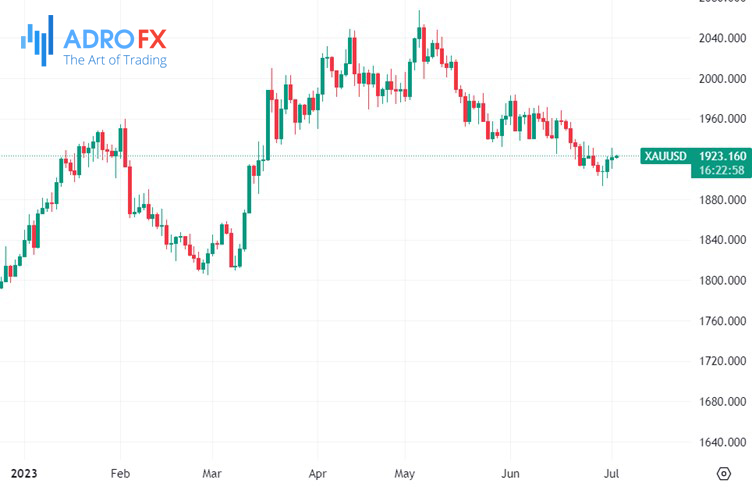
However, there are signs of weakening momentum around the $1,900 level, suggesting the possibility of a corrective move. It's important to note that a loss of momentum alone does not guarantee a sudden reversal in price. If there is a significant break below $1,900, gold could experience another downward plunge, particularly if momentum improves. Nonetheless, considering its nearly 9% decline since early May, a correction would not be surprising.
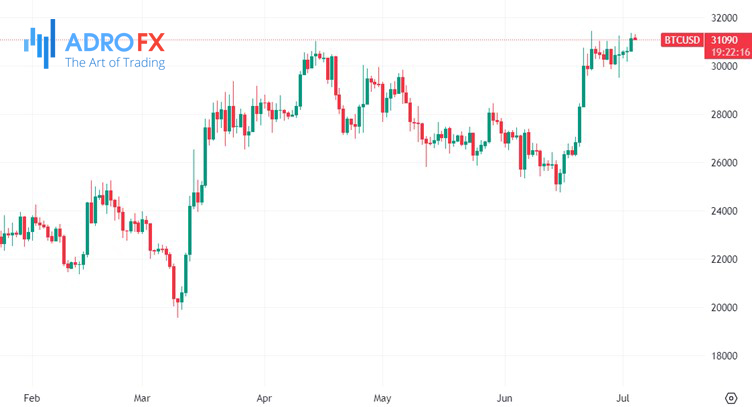
Meanwhile, Bitcoin continues to exhibit significant fluctuations within the range of $30,000 to $31,000, which could be viewed as encouraging by the crypto community following its recent impressive rally. Although it hasn't made further gains, the fact that it has not retraced a portion of those gains suggests that traders remain optimistic, perceiving this period as a consolidation phase within a larger upward movement. The ultimate outcome will depend on future news developments, and time will provide clarity on whether this hypothesis holds true. Nevertheless, the current market behavior is viewed as positive based on the information available thus far.
Related Articles
Latest updates
Latest updates


Technical Analysis
Latest updates


