Understanding and Calculating the PE Ratio in Trading

In the intricate landscape of finance, understanding the Price-to-Earnings (PE) ratio is paramount for investors and traders seeking to gauge the true worth of a company's stock. The PE ratio serves as a fundamental financial metric, juxtaposing a company's earnings, usually measured through Earnings Per Share (EPS), with its current share price. This ratio is a cornerstone of financial analysis, primarily embraced by long-term investors intent on deciphering whether a stock is overvalued or undervalued. When a company exhibits a PE ratio of, say, 10, it is often perceived as an opportunity for investment, while a ratio of 40 may signal overvaluation. However, as we will explore, a lower PE ratio doesn't always equate to a better investment, as companies with higher PE ratios can frequently outperform their peers. In this article, we will delve into the mechanics of calculating the PE ratio, its various iterations, and its common alternatives. We will also decipher how investors and traders can harness this financial tool for effective decision-making.
What Is the Price-to-Earnings (PE) Ratio?
The Price-to-Earnings (PE) ratio is a fundamental financial metric that evaluates a company's earnings in relation to its share price. In this calculation, "earnings" typically refers to the company's Earnings Per Share (EPS), while "price" represents the current share price.
The PE ratio serves as a pivotal figure, predominantly utilized by long-term investors seeking to ascertain whether a company's stock is either undervalued or overvalued. To illustrate, a company sporting a PE ratio of 10 is commonly perceived as undervalued, whereas one with a PE ratio of 40 is considered overvalued.
Nonetheless, as we will elucidate below, a lower PE ratio does not invariably denote a superior investment compared to a company with a higher PE ratio. In fact, quite often, firms with higher PE ratios exhibit stronger performance than their counterparts.
Calculation of the PE Ratio
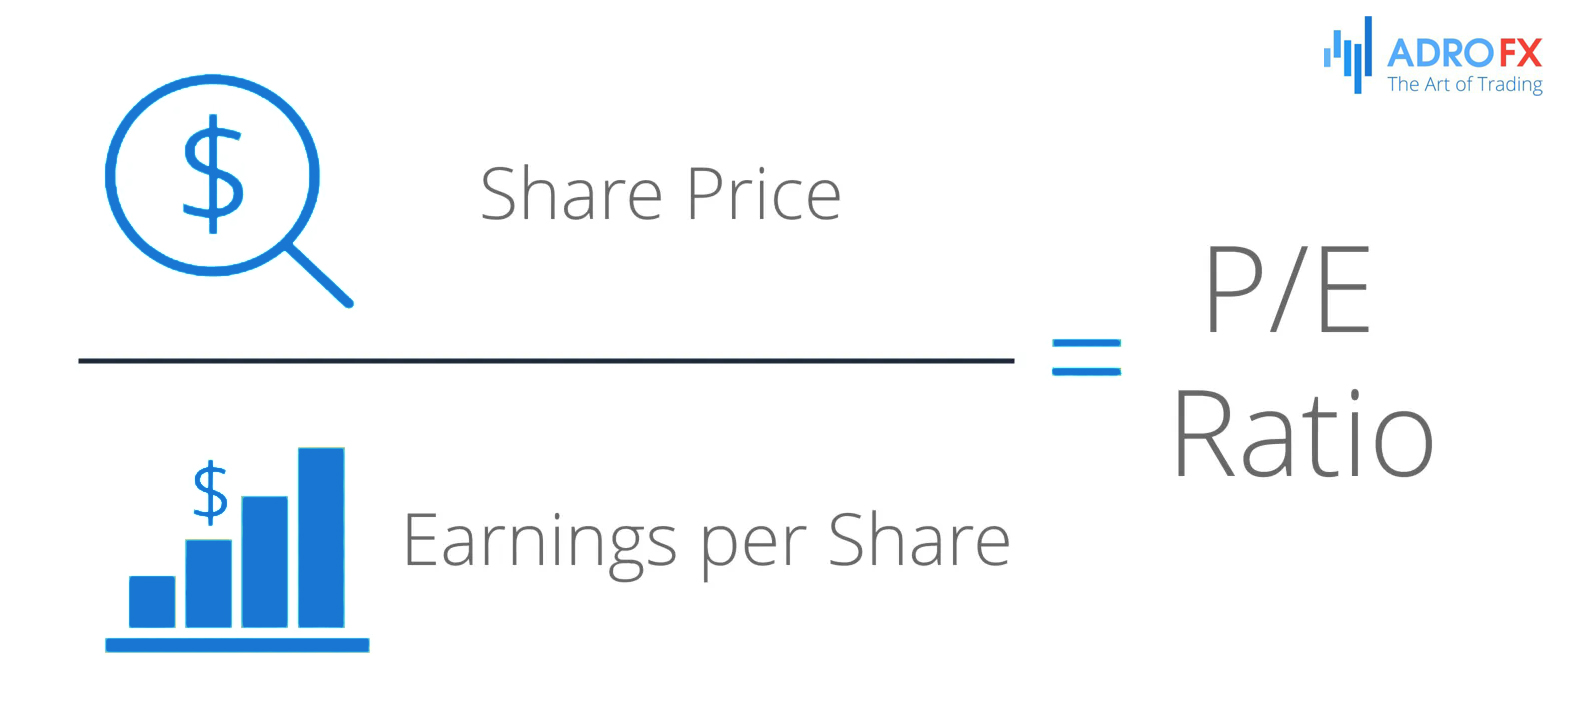
The computation of the PE ratio is a straightforward process, achieved by using the following formula:
PE Ratio = Market Value per Share / Earnings Per Share
The "market value per share" signifies the prevailing share price. For instance, in February 2021, Apple's share price traded at $136, constituting the market value per share.
Earnings Per Share (EPS) is usually obtainable from a company's income statement. It is calculated by dividing a company's net earnings by its outstanding shares. To provide an example, if a company records a net profit of approximately $1,000,000 and has 10,000 outstanding shares, the EPS amounts to 100.
Multiple types of EPS exist in the market, including diluted EPS, ongoing EPS, forward EPS, and headline EPS. Furthermore, the PE ratio can be based on Generally Accepted Accounting Principles (GAAP) or non-GAAP earnings.
As a trader, you can calculate the PE ratio of a company independently. However, it is readily available on most free charting and financial media platforms, such as Investing.com and SeekingAlpha.
Variants of the PE Ratio
Various iterations of the PE ratio hold relevance for investors and traders. Firstly, there is the trailing PE ratio, which compares the current price to past earnings. One typically utilizes a company's trailing twelve-month earnings to determine this ratio.
Secondly, there is the forward PE ratio, calculated using the current stock price and the average earnings forecasts provided by analysts. These average earnings forecasts can be sourced from platforms like SeekingAlpha, Finviz, Investing, and Yahoo Finance. Investors often favor the forward ratio due to its forward-looking nature, focusing more on the future than the past.
Thirdly, the GAAP and non-GAAP PE ratios employ the current share price and GAAP or non-GAAP earnings. As illustrated earlier, these ratios can vary for the same company.
Lastly, the Price-to-Earnings to Growth (PEG) ratio incorporates a company's growth into the PE ratio. It is determined by dividing the share price by EPS and subsequently dividing the result by EPS growth, offering a more comprehensive perspective on a company's valuation.
Common Alternatives to the PE Ratio
Beyond the Price-to-Earnings (PE) ratio, there are several other widely recognized metrics for evaluating a company's financial health and value. One such alternative is the Price to Sales (PS) ratio, which assesses a company's revenue over a specific period in relation to its share price. While this metric provides valuable insights, it tends to focus more on a company's revenue generation and less on its profitability, which is a primary concern for many investors.
Another valuable alternative is the Enterprise Value (EV) to Earnings Before Interest, Tax, Depreciation, and Amortization (EBITDA) ratio. This ratio compares a company's enterprise value, which accounts for market capitalization, equity, and debt, to its EBITDA. The EV to EBITDA ratio offers a more comprehensive view of a company's intrinsic worth and financial performance.
Additionally, the Price to Cash Flow ratio is a favored alternative. It compares the current share price to a company's current Free Cash Flow (FCF), providing insights into its liquidity and financial strength.

How to Utilize the PE Ratio in Trading
In the realm of trading, the PE ratio is not typically a go-to metric for day traders. Their focus primarily centers on a company's share price movements rather than its intrinsic value. On the other hand, long-term investors employ the PE ratio in various ways.
Investors commonly compare a company's PE ratio to broader benchmarks, such as the overall PE ratio of the market or an index like the S&P 500. This comparative analysis can involve assessing a company's PE ratio in relation to that of its peer companies or in the context of the broader market.
For instance, when comparing a company's PE ratio to the S&P 500 PE ratio, a lower ratio may suggest that the company is undervalued. Similarly, investors often scrutinize a firm's PE ratio in comparison to those of its industry peers.
A frequent misconception among investors is the unwavering preference for low PE companies. However, history has shown that many high PE stocks, such as Shopify and Crowdstrike, have outperformed their lower PE counterparts. This phenomenon arises from the heightened demand for innovative tech companies, which typically boasts higher PE ratios, compared to traditional sectors like oil and gas.
In summary, while the PE ratio remains a valuable metric for long-term investors, traders often direct their attention toward shorter-term price movements. Understanding the context and nuances of the PE ratio can guide investors in making informed decisions that align with their investment strategies and objectives.
Conclusion
The Price-to-Earnings (PE) ratio stands as a pivotal metric in the financial world, providing valuable insights into the valuation of a company's stock. This ratio offers a comparative lens through which long-term investors assess a company's intrinsic worth, by weighing its earnings against the share price. However, the nuances of the PE ratio extend beyond this simplistic calculation.
As we've uncovered, variations of the PE ratio, such as the trailing, forward, and PEG ratios, cater to distinct aspects of a company's performance and growth potential. Moreover, the PE ratio has its alternatives, like the Price to Sales (PS) ratio, Enterprise Value (EV) to Earnings Before Interest, Tax, Depreciation, and Amortization (EBITDA) ratio, and the Price to Cash Flow ratio, each providing unique perspectives on a company's financial health.
While long-term investors often rely on the PE ratio for decision-making, traders in the dynamic world of financial markets may prioritize other factors, such as price movements. The PE ratio, when juxtaposed with industry benchmarks or peer comparisons, can guide investors toward undervalued opportunities. It's essential to dispel the notion that lower PE companies are inherently superior, as history attests to the strong performance of high PE stocks, especially in innovative sectors.
In sum, the PE ratio is a multifaceted tool that enhances our understanding of a company's valuation. Its application extends from traditional investors to savvy traders, each seeking to make informed decisions aligned with their financial objectives. By deciphering the intricacies of this fundamental metric, individuals in the financial realm can navigate the complex terrain of investments and trading with greater precision and confidence.

About AdroFx
Established in 2018, AdroFx is known for its high technology and its ability to deliver high-quality brokerage services in more than 200 countries around the world. AdroFx makes every effort to keep its customers satisfied and to meet all the trading needs of any trader. With the five types of trading accounts, we have all it takes to fit any traders` needs and styles. The company provides access to 115+ trading instruments, including currencies, metals, stocks, and cryptocurrencies, which make it possible to make the most out of trading on the financial markets. Considering all the above, AdroFx is the perfect variant for anyone who doesn't settle for less than the best.
Related Articles


Latest updates
Latest updates


Technical Analysis
Latest updates


