TRIX Indicator: Day Trade With the Triple Exponential Average
Triple Exponential Average is an indicator that determines the trend in the forex market. It is not included in the set of standard tools of the MetaTrader 4 platform. It belongs to the category of old-timers among the methods of technical analysis of markets. This is not surprising, because the tool was created back in 1980. It is based on standard moving averages, and it has several variants of use in practice. Let's analyze the TRIX indicator and its application to forex trading strategies.
Triple Exponential Average (TRIX) Description
The TRIX indicator is based on a regular moving average - the most accessible and popular tool among traders. The only difference is that the indicator uses a triple-smoothed moving average. It has the form of an oscillator and is located in a separate window below the main chart of the financial instrument.
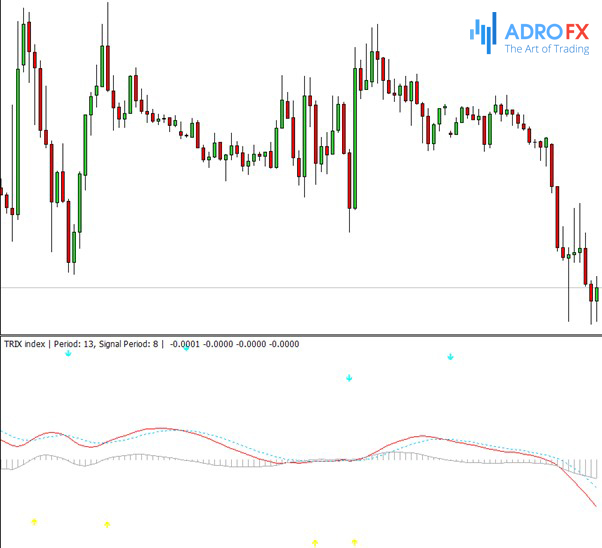
Visually, it represents the interlacing of two lines and their movement around the zero level. Each of the curves periodically changes color from red to green and vice versa, indicating a change in market sentiment. The thicker line is considered the main line. The appearance of the TRIX indicator ready to work looks like this:
Interpreting TRIX Indicator
It is quite difficult to find specific entry points by this oscillator alone, but the tool allows you to evaluate the overall market dynamics and get a number of confirmation signals. Good entry points can be obtained by combining this indicator with standard moving averages and resistance and support levels. The TRIX works best in trending markets.
In general, the direction of the indicator curve identifies the trend direction well. Due to multiple smoothing, random fluctuations have little effect on changes in the direction of the curve. When the indicator is used in the higher time frame and turns in any direction, the current trend on the working time frame has a corresponding direction. Of course, false signals sometimes occur, but they are incommensurably less than in other oscillators. In addition, if you learn the behavior of the oscillator on the history, you can learn to effectively filter them.
The main signals that can be obtained using TRIX are divergence and zero line cross. Theoretically, it is possible to use overbought and oversold areas, but the location of these areas varies greatly from asset to asset, so an individual approach is needed. For some financial instruments, the indicator may not go beyond the range from -1 to +1, and for some, it may be -5 and +5.
TRIX gives signals in a separate window. It is a trend oscillator, so you can use its signals to identify both the direction of the trend and the moments of price entry/exit into oversold and overbought areas.
The TRIX window shows one central level. This is the zero line. If the oscillator's movings are near it, it means that the bears and the bulls are on an equal footing. If the moving averages cross this level up and down as if wrapping it in a "bundle", it is a sign of flat - the forces of both sides are about equal and it is unknown, which way the trend will go. Keep in mind the "spring effect", the longer the market will be compressed moving in flat, the stronger will be the subsequent impulse.
Movings of the oscillator (there are two of them) are colored in different colors - so they are much easier to distinguish.
Let's consider several variants of the instrument signals.
The 0 Level Signals
The simplest signal is a breakdown of the zero level by the moving averages. The direction of penetration will indicate the type of trend.
The zero line is the balance level, where bullish and bearish forces are equal. If the lines penetrate this level from the bottom upwards and continue to rise, it is a sign that the bulls are currently at an advantage - an uptrend is developing.
In the opposite case, when the lines cross the zero boundary from the bottom upwards and start falling further, it can be said that the advantage is on the side of the bears. A downtrend is developing.
TRIX signals from the zero level are very similar to stochastic oscillator signals.
The indicator consists of two curves - the main TRIX line and the signal line. When the moving cross each other, it may indicate a change in trend. The type of new trend can be determined by the direction of the crossing.
Types of signals:
- Sell. The main TRIX line breaks the signal moving average from the top down. This is a sign that the market has been overtaken by sellers and a downtrend has begun;
- Buy. The main TRIX line breaks the signal line from the bottom to the top. This indicates the advantage of buyers in the market. A new uptrend is developing.
Multiple crossing of the lines with each other, as a result of which the movings seem to be woven into one bundle, indicates a sideways movement (flat). There is no clear trend in the market, the bulls and the bears are fighting. It is necessary to take a waiting position and not enter the market until the flat ends and the price moves in the direction of the bearish or bullish trend.
Bullish and Bearish Divergences
Divergence is one of the strongest reversal signals. It is easy to find - just compare the indicator and the chart. If they diverge, it is the first indication of a divergence, which can indicate a change in trend.
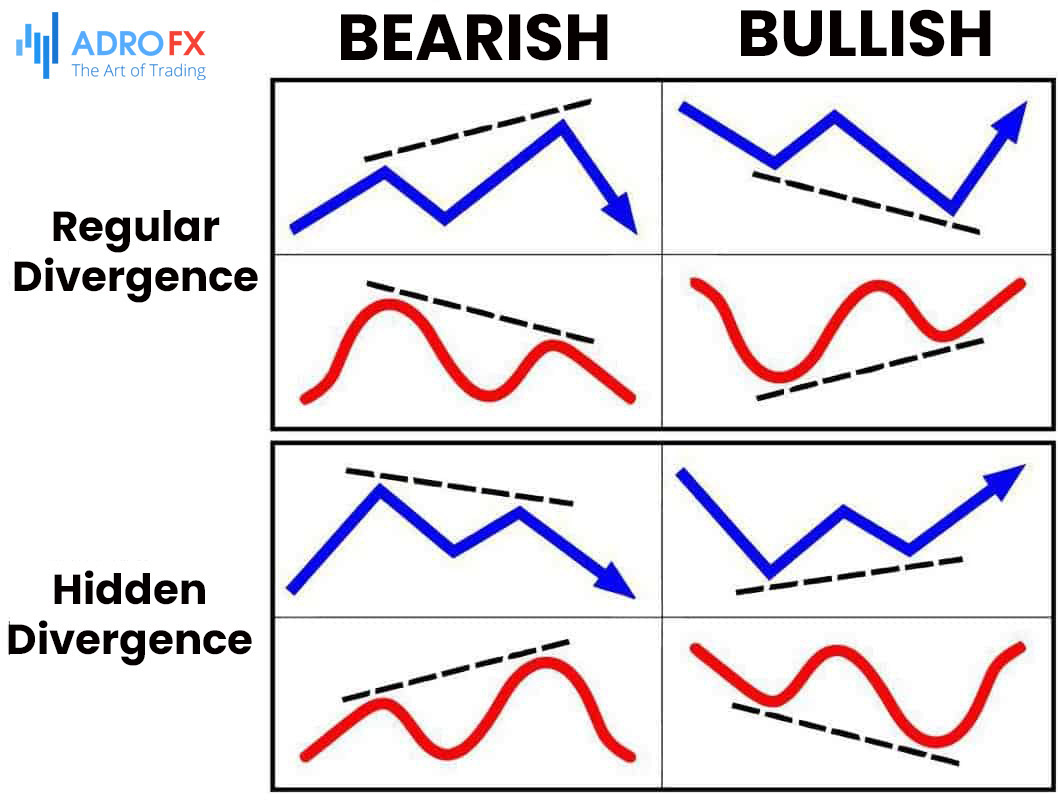
The divergence can be bullish or bearish. In the former case, the TRIX lines are trending upwards while the price chart is trending downwards. This is a signal that the chart will soon reverse into an uptrend.
A bearish divergence appears when the TRIX lines are down and the chart is moving up. Such a signal could indicate a reversal of the chart in the direction of a downtrend.
As you may have noticed, the direction of the reversal on a divergence signal always coincides with the signal given by the indicator. That is, if the TRIX goes down, the price will soon repeat this movement.
While trading with the TRIX indicator, Stop Losses are usually placed behind the closest local highs or lows. It is best to combine the signals with other ways to analyze the market, because not one, even the most perfect indicator, alone does not give the number of profitable positions necessary for the successful operation of the trader. Remember that the profitability of trading depends very much on the broker that you choose!
Installing and Setting the TRIX indicator in MetaTrader 4
The indicator is only available to MetaTrader users. The tool is not included in the standard package, but its installation will not take much time. The installation files can be found online on numerous websites. You just need to download them, unzip and copy them to the MT folder, where the custom tools are (Catalog/MQL/Indicators). We remind you that you can get quick access to the Meta Trader data folder by using the D+Shift+Ctrl command (simultaneous pressing of three keys when the terminal is started).
When the indicator is copied into the catalog, the terminal must be restarted to complete the installation. Next, open the desired chart and add TRIX to it from the menu Insert/Indicators/Custom/TRIX.
The tool has very simple settings. Since the main TRIX signals will be given on the basis of the exponential curve data, the main parameter will be the period of this line. The "EMA_Period" item is responsible for it.
The value of the exponential line period will determine the quality and quantity of TRIX signals. You should not set too low a value, hoping to get a large number of signals. The accuracy of such signals will be very low, so they will not bring much profit.
High values of EMA__Period will minimize the number of incoming signals, and therefore you may miss a lot of good entry points. Choose average values, focusing on the volatility of the pair and the time frame of the chart. If you are not experienced enough in setting up moving averages, then just leave the standard parameters unchanged. They are universal and suitable for most strategies.
In the other tabs, you can customize the appearance of the indicator.
Advantages and Disadvantages of the TRIX Indicator
TRIX differs favorably from simple MACD and Stochastic. This tool does not redraw its readings, is effective in any time frame, and is suitable for both scalping and trend trading.
There are several main advantages of the TRIX:
- Filters price noise by smoothing the triple exponential curve;
- Correctly shows the trend, it is rarely wrong;
- It is suitable for divergence trading, which is considered one of the strongest reversal signals;
- It does not overdraw;
- Can be used both solo and in combination with other indicators.
TRIX does not have any disadvantages, which critically affect trading efficiency. The disadvantages of the tool are only a slight lag of its signals when working in low time frames such as one-minute or five-minute.

TRIX Indicator Trend Trading Strategy
This strategy is based on the signals of TRIX and a trend oscillator MACD. Positions will be placed in the direction of the trend. The working time frame is M15.
To get the maximum profit, we enter the market only at the beginning of the trend when there is a reversal of the chart. The reversal will be indicated by TRIX signals. The confirmation signal will be given by MACD.
The currency pair should be volatile, so calm and exotic assets, whose charts usually "sleep" in a flat, are not recommended to use. The volatility must be sufficient for you to make a profit without the price triggering a Stop Loss.
The buy order is placed under the following conditions:
- The TRIX indicator leaves the oversold area;
- The TRIX movings cross each other on the way out of the critical zone;
- The MACD histogram rises above zero.
We open a position after the signal candle closes. Stop Loss is placed a few points below the nearest minimum. To squeeze a maximum profit from the market, set a Trailing Stop.
The sell order is placed under opposite conditions:
- The TRIX movings are out of overbought territory;
- The signal line and the main line cross each other;
- The MACD indicator draws a bar below the zero level.
If everything is consistent, we can open a sell order. We set a Stop Loss a few pips further than the maximum. The profits are fixed by the Trailing Stop.
You can also close the trade manually when MACD breaks zero in the opposite direction or when the TRIX reaches the opposite critical zone.
This strategy can give about 70-75% profitable signals. If you trade in a higher time frame, the percentage of profitable trades will be higher. An additional indicator, Fibonacci lines or resistance/support levels can be attached to the strategy for better filtering of signals.
Also, the TRIX indicator can be used instead of Stochastic. Its lines are smoother, therefore they react less to price noise and give signals less frequently. Keep this in mind when creating your strategy.
Conclusion
In conclusion, the Triple Exponential Average (TRIX) indicator is a useful tool for determining the trend in the forex market. The TRIX is a triple-smoothed moving average and works best in trending markets. The direction of the indicator curve identifies the trend direction well. The TRIX gives signals in a separate window and can be used to identify both the direction of the trend and the moments of price entry/exit into oversold and overbought areas. While false signals may occur, they are incommensurably less than in other oscillators. Overall, the TRIX indicator can be combined with standard moving averages and resistance and support levels for good entry points and can be used to evaluate the overall market dynamics and get a number of confirmation signals.

About AdroFx
Established in 2018, AdroFx is known for its high technology and its ability to deliver high-quality brokerage services in more than 200 countries around the world. AdroFx makes every effort to keep its customers satisfied and to meet all the trading needs of any trader. With the five types of trading accounts, we have all it takes to fit any traders` needs and styles. The company provides access to 115+ trading instruments, including currencies, metals, stocks, and cryptocurrencies, which make it possible to make the most out of trading on the financial markets. Considering all the above, AdroFx is the perfect variant for anyone who doesn't settle for less than the best.
Related Articles


Latest updates
Latest updates


Technical Analysis
Latest updates


