Strategic Insights: Mastering Top-Down Forex Trading with Reliable Strategies

In the dynamic world of forex trading, the quest for the most reliable strategy is a constant pursuit among traders seeking a competitive edge. Distinguished traders stand out through a unique approach - the top-down methodology. This strategic perspective involves delving into the broader market picture and identifying prevailing trends, primarily focusing on higher time frames in technical analysis. Successful traders begin their analysis with a panoramic view, shaping their trading mindset based on the identified trends. This article explores the significance of the top-down approach and delves into specific trading strategies that align seamlessly with this methodology, providing traders with a holistic and effective perspective for navigating the complexities of the forex market.
What Constitutes the Most Reliable Forex Strategy?
Distinguished traders possess a unique aspect in their trading approach that sets them apart from others - the top-down methodology. This involves examining the broader picture or prevailing trend first, particularly focusing on higher time frames in technical analysis. Successful traders begin by analyzing charts on higher time frames to identify trends, shaping their trading mindset accordingly. For instance, if they ascertain a bullish trend on a higher time frame, they exclusively execute BUY trades and adhere to that direction until the trend concludes.
To pinpoint optimal entry and exit points with precision, traders leverage shorter time frame charts. Trades on the shorter time frame charts align with the trend identified on higher time frames, allowing for accurate entries and exits within the overarching trend. Regardless of tempting counter-trading opportunities, successful traders steadfastly avoid placing trades counter to the identified trend.
By operating on a higher time frame, traders capitalize on significant trend movements, while signals from smaller time frames feature tighter stop losses for added precision.
Several established trading strategies align seamlessly with the top-down approach, already acknowledged and embraced by traders as effective methodologies. The effectiveness of these strategies can be further amplified through the meticulous application of the top-down approach.
EMA Cross Over
The Exponential Moving Average (EMA) crossover strategy takes center stage as a powerful tool for traders seeking both simplicity and profitability. Moving Averages, widely embraced for their accuracy and ease of use, find a star performer in the EMA, celebrated for its rapid responsiveness and minimized lag. The EMA's ability to assign greater significance to recent price movements enhances its credibility as a reliable indicator in guiding strategic trading decisions.
The EMA crossover strategy, a go-to method for many traders, operates on the premise of utilizing two moving averages - a fast-moving average and a slow-moving average. This strategic pairing becomes a key driver in signaling potential market trends. In the context of an uptrend, the strategy comes to life when the fast moving average gracefully crosses over the slow moving average in an upward direction, signaling a bullish trajectory. Conversely, a downward crossover of the fast moving average below the slow moving average signifies an imminent downtrend, providing traders with a timely alert to consider bearish positions or exit existing long positions.
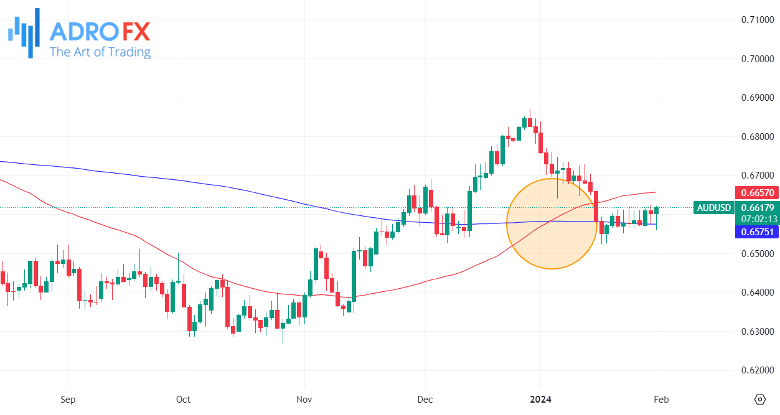
What sets the EMA crossover apart is its seamless integration with the top-down approach, adding a layer of sophistication to this straightforward strategy. By examining higher time frames in technical analysis, traders gain a panoramic view of prevailing trends. This broader perspective not only shapes their trading mindset but also refines the precision of entry and exit points. The EMA crossover, when implemented within the top-down framework, becomes a nuanced tool for traders to navigate the intricacies of the forex market.
As traders delve into the charts to apply the top-down approach, they unlock a treasure trove of insights into optimal entry and exit points. This methodical exploration ensures that the EMA crossover strategy is executed with precision, aligning trades with the prevailing trend identified in higher time frames. The strategic amalgamation of the EMA crossover and the top-down approach offers traders a holistic perspective, elevating the effectiveness of this straightforward yet highly profitable MT4 trading strategy.
In essence, the EMA crossover strategy stands as a testament to the marriage of simplicity and profitability in MT4 trading. Its integration with the top-down approach not only adds depth to its application but also empowers traders with a nuanced understanding of market trends, ultimately contributing to enhanced trading success.
Moving Average Convergence And Divergence (MACD)
Moving Average Convergence And Divergence (MACD) is a pivotal tool in the arsenal of forex traders, celebrated for its versatility and reliability. This indicator not only gauges the momentum of a trend but also offers multiple trading methods that cater to diverse trading styles.
One of the fundamental MACD strategies involves observing the crossover of the ZERO line. When the MACD line crosses above the ZERO line, it signals a shift toward bullish momentum, indicating a potential buying opportunity. Conversely, a crossover below the ZERO line suggests a bearish momentum, prompting traders to consider selling positions. This simple yet effective approach provides clear signals for entering or exiting trades, making it a preferred choice for many traders.
Another technique involves the interaction with the signal line. The MACD indicator consists of two lines – the MACD line and the signal line. When the MACD line crosses above the signal line, it generates a bullish signal, signaling a potential upward price movement. Conversely, a crossover below the signal line indicates a bearish signal, suggesting a possible downtrend. Traders often rely on these crossovers to make informed decisions, aligning their trades with the prevailing market direction.
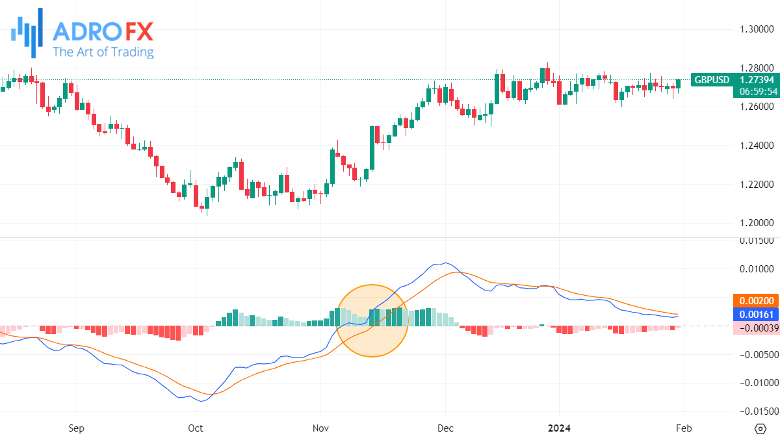
Furthermore, MACD is renowned for its application in identifying convergence and divergence. Convergence occurs when the price of an asset aligns with the MACD indicator, confirming the existing trend. On the other hand, divergence signifies a potential reversal, as the price moves in the opposite direction of the MACD. Traders keen on spotting trend reversals or continuations find these divergence and convergence signals invaluable for making strategic decisions.
The adaptability of MACD extends to its integration into automated trading systems. Many traders incorporate MACD into algorithmic strategies, allowing for seamless and systematic execution of trades based on predetermined MACD signals. This automation not only saves time but also ensures that trades are executed with precision, removing emotional biases from the decision-making process.
In conclusion, MACD's reputation for reliability in the forex market is well-deserved. Whether traders opt for crossovers of the ZERO line, interactions with the signal line, or the identification of convergence and divergence, MACD offers a diverse toolkit for analyzing trends and making informed trading decisions. Its widespread use in automated trading systems underscores its significance as a go-to indicator for both novice and experienced traders navigating the dynamic forex landscape.
Bollinger Bands
Bollinger Bands, a renowned technical analysis tool, has etched its place as a cornerstone for trend-following strategies in the dynamic world of forex trading. Developed by John Bollinger, this indicator has proven to be a versatile and effective means of gauging trend direction, market volatility, and potential entry and exit points.
One of the primary strengths of Bollinger Bands lies in its ability to assist trend traders in identifying the overall direction of the market. The bands consist of a central moving average line, flanked by an upper and lower band that represents standard deviations from the moving average. When the price is trending upward, the upper band acts as a dynamic resistance level, reflecting the upper limit of the price movement. Conversely, in a downtrend, the lower band serves as dynamic support, outlining the lower boundary of the price movement. Traders leverage these directional cues to make informed decisions on entering or exiting trades.
Bollinger Bands not only provide directional insights but also offer valuable indications of market volatility. During periods of increased volatility, the bands widen, signifying potential price fluctuations. Conversely, in periods of low volatility, the bands contract, indicating a more stable market. Recognizing these changes in volatility helps traders adjust their strategies accordingly, whether opting for breakout or range-bound trading approaches.
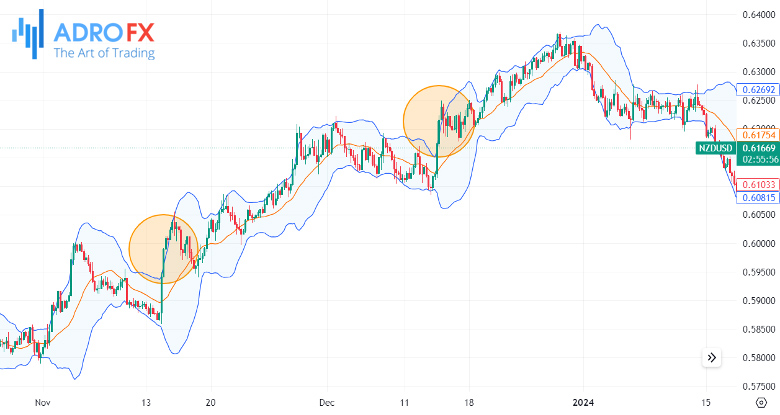
The directional movement of the bands itself serves as a guide for entry points in trend-following strategies. When the price consistently touches the upper band, it signals a strong bullish trend, presenting an opportunity for traders to enter or maintain long positions. Conversely, repeated touches of the lower band suggest a robust bearish trend, prompting traders to consider short positions or exit long ones.
In addition to directional cues, Bollinger Bands introduce the concept of support and resistance through the outer bands. Traders often use these bands as reference points for identifying potential reversal or continuation zones. Breakouts above the upper band or below the lower band can indicate significant market movements, providing traders with valuable insights for decision-making.
In conclusion, Bollinger Bands stands as an outstanding indicator for trend-following strategies in forex trading. Beyond offering directional cues, they contribute to understanding market volatility, provide entry and exit points, and introduce the concepts of support and resistance. Traders, from novices to seasoned professionals, find Bollinger Bands to be an indispensable tool for navigating the complexities of the forex market with precision and confidence.
Support And Resistance
Support and Resistance stand as the cornerstone of all technical tools and indicators, earning their reputation as the bedrock of successful trading strategies. Manifesting as either horizontal lines or angled trend lines, Support and Resistance offer crucial insights for technical traders. Virtually every trader relies on these dynamic elements, assessing nearly every price movement in relation to the nearest Support or Resistance. Discussions about the strength of Support, the resilience of Resistance, and their impact on trading decisions are integral to traders' daily discourse.
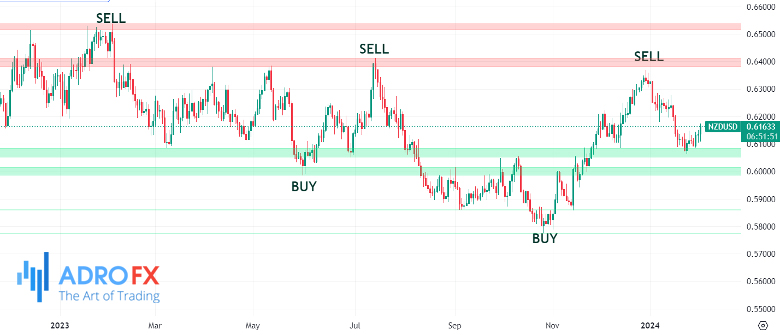
Engaging in a time-honored tradition, traders commence their trading day by scrutinizing higher time frame charts to pinpoint Support and Resistance levels. Those already entrenched in trading positions turn to the next higher time frame chart to identify upcoming resistance or support levels. The strength attributed to Support and Resistance in higher time frame charts enhances their significance, as a breakout or rejection in these charts promises higher returns for astute traders. The meticulous consideration of these foundational elements underscores their pivotal role in constructing robust and effective trading strategies.
Conclusion
As we conclude our exploration into what constitutes the most reliable forex strategy, the importance of a top-down approach and its integration into established trading methodologies becomes evident. Distinguished traders distinguish themselves by adopting a comprehensive view, starting with higher time frames to capture prevailing trends. The discussed strategies, including EMA Crossover, MACD, Bollinger Bands, and Support and Resistance trading, exemplify the effectiveness of the top-down approach. By leveraging this strategic perspective, traders not only navigate the intricacies of the forex market with precision but also enhance the reliability of their trading strategies. The meticulous application of these methodologies underscores the enduring relevance of time-tested principles in constructing robust and effective approaches to forex trading.

About AdroFx
Established in 2018, AdroFx is known for its high technology and its ability to deliver high-quality brokerage services in more than 200 countries around the world. AdroFx makes every effort to keep its customers satisfied and to meet all the trading needs of any trader. With the five types of trading accounts, we have all it takes to fit any traders` needs and styles. The company provides access to 115+ trading instruments, including currencies, metals, stocks, and cryptocurrencies, which make it possible to make the most out of trading on the financial markets. Considering all the above, AdroFx is the perfect variant for anyone who doesn't settle for less than the best.
Related Articles


Latest updates
Latest updates


Technical Analysis
Latest updates


