Standard Deviation Explained: How to Read and Use the Indicator
The Standard Deviation indicator, which is in demand among traders, is an integral part of various profitable trading strategies. Judging by its name, it is clear that it is borrowed from mathematical statistics. The indicator is used in many profitable strategies to estimate the market volatility and find profitable points to open the trades. Let's consider in detail the principle of its work, installation, setup rules, and its readings.
What Is Standard Deviation Indicator?
The Standard Deviation (SD) indicator shows the degree of price deviation from the average values over a certain period of time. In other words, it determines how strongly the quotes values deviate from the average indicators. The degree of deviation is marked with the letter "O" and directly indicates the strength of the market volatility. The higher the Standard Deviation readings are, the more volatile the market is and the wider the range of price changes is.
The tool can be used in combination with the X-Lines indicator for drawing the levels. In this case, it is necessary to open trades when the price is near one of the strong levels and SD has risen above the critical level.
Standard Deviation is often used by experienced traders and investors not as an indicator for finding trading signals, but as a statistical tool for forming portfolios of shares or other valuable assets. It helps calculate the degree of risk when investing in various assets.
The Standard Deviation indicator shows the range of the instrument price variation, characterizing its volatility. Usually, the indicator is expressed in units of the price of the analyzed asset. Standard Deviation is not so much an indicator as a function of the price standard deviation, which is actively used in mathematical statistics and for building a security portfolio. The indicator is used to calculate the risk of each individual security and the total risk of the portfolio.
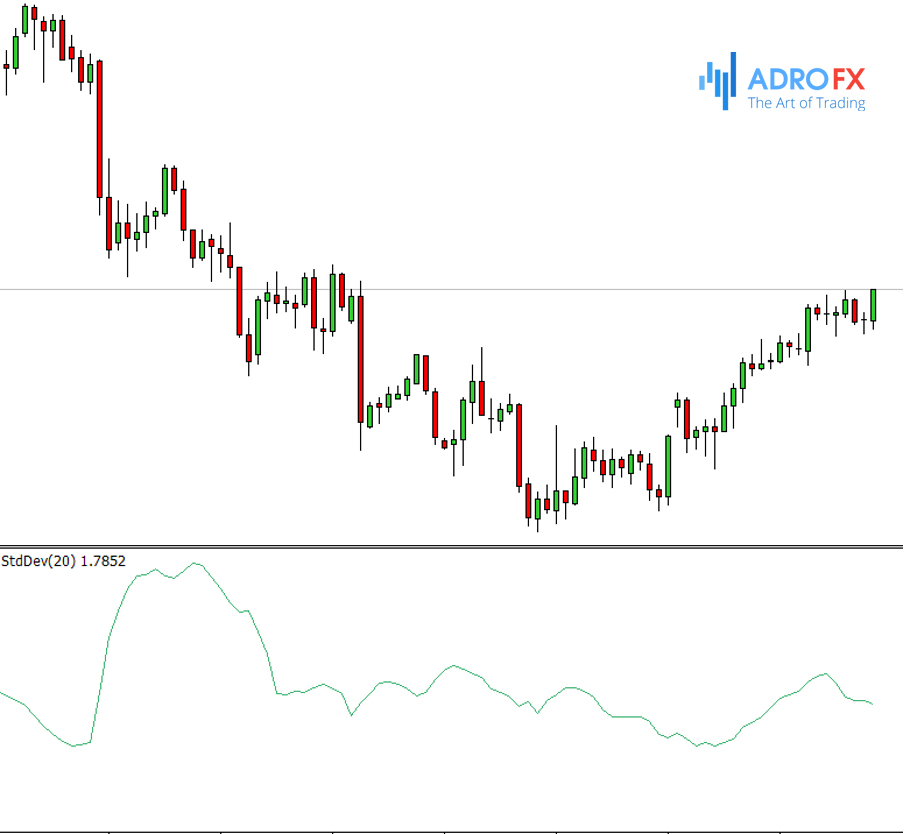
The tool looks like a broken line and is located in a separate window of the terminal under the main chart. The higher the value of the line – the stronger the volatility of the asset. And vice versa, the lower the line – the less volatility.
The Logic Behind the Standard Deviation Indicator
Since the price of any financial instrument is constantly changing, the first step is to determine the general vector of price changes - to calculate the Moving Average (in the basic version for 20 periods). After that price deviation of each period from the received vector should be received, i.e. the difference between the closing price of each period and the value of the Moving Average should be calculated. The next step is to square each of the obtained differences and sum up those squares for the specified number of periods, thus obtaining the mean square deviation. The last step is to extract the square root of the result. The method of calculation can be written as:
Standard Deviation = √(∑ ((CP - SMA(n))2)/n),
where CP is the period closing price, SMA is the Moving Average, n is the number of averaging periods. Thus, the standard deviation is calculated not only from the price but exactly from the price vector, i.e. from the Moving Average.
We can say that price fluctuates relatively to its SMA as to its rotation axis. And the probability of the price being at a lesser distance from SMA is higher than at a greater price distance. Therefore, if the price moves away from its SMA by the value of the Standard Deviation, it is more likely to return to its SMA. I.e. in this situation, the Standard Deviation starts to carry out the oscillatory function. But it should be considered that when the trend changes, the vector also changes its direction (SMA changes its direction), and Standard Deviation at this time usually increases, indicating that the price goes beyond its previous normality, performing the function of trend indicator.
Understanding Standard Deviation Indicator Readings
It should be noted that purely the indicator in its classic meaning is rarely used, however, it can be used as a base for constructing more complicated indicators, such as Bollinger Bands, or in complex with other indicators.
Considering that volatility is usually weak in sideways periods, the Standard Deviation has low values in these periods. And it often duplicates the price extremums with its extremums. Now of the formation of a new trend, Standard Deviation breaks out its extremums and starts growing. The trade is placed at the moment when the line of the indicator breaks out the sideways trend, with placing a Stop order after the last price extremum.
The Standard Deviation indicator can be used as a trend filter in combination with oscillators. When the Standard Deviation line breaks out of the sideways trend, a trade is placed in the direction of the trend. After that, either additions to the position or re-entries (if there was an exit) are made at the exit of the oscillator from the overbought/oversold area, according to the trend direction. The Stop order in this situation is placed behind the last local extremum. As an example, we can mention the system of Standard Deviation and the RSI oscillator, where the trend indicator will be the indicator of the Standard Deviation, and the signal for placing orders will be RSI readings in the direction of the Standard Deviation.
Installing and Setting the Standard Deviation Indicator
The indicator is suitable for working with any assets. It is not in the trading terminal, so you must download and install it separately.
To download the distribution kit, just find it online, there are numerous options available. After that, unzip the downloaded archive and proceed with the installation:
- Run the MT4 terminal;
- Press the key combination Ctrl+Shift+D, or select the command File -> Open data folder;
- Open the MQL folder, and then the Indicators folder. Copy the entire archive into it;
- Restart your terminal.
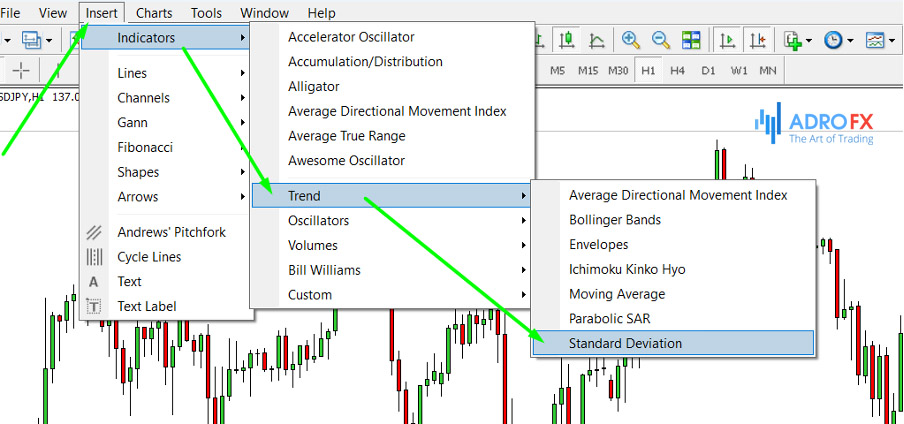
To add the indicator on the working chart, open the "Insert" menu at the top of the terminal. Go to the indicators category and then to the "Trend Indicators" subsection. Find the name of the indicator in the opened list - Standard Deviation and click on it. The indicator will appear below the working chart. You can begin setting up the parameters and working with the tool.
Indicator settings are very similar to those for standard Moving Average Lines. The most important parameter is the period value - the indicator sensitivity to price changes depends on it. By default, the period is 20 bars.
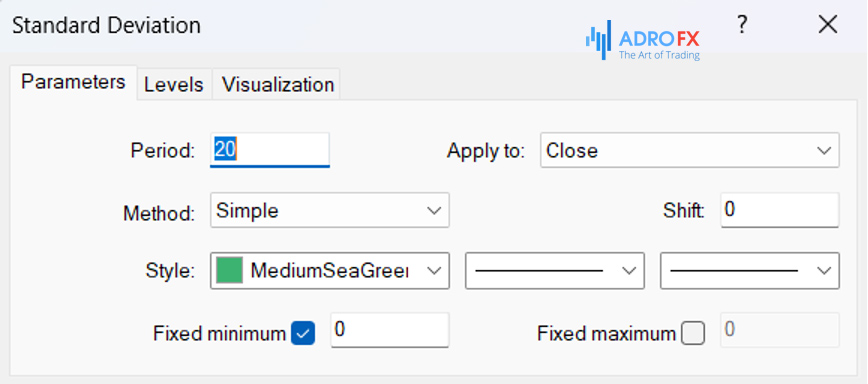
Also in the settings, you can specify the type of prices to be used for calculation. You can do this in the "Apply to" column. The default value is "Close", i.e. all calculations will be carried out by candlestick close prices.
In the column "MA Type" you can set the type of MA, which will be the basis for calculating the deviation of the price. By default, the standard Moving Average "Simple" is used.
Filtering Standard Deviation Signals
The main problem when trading using Standard Deviation is false indicator signals at the moments when the price gets "stuck" in one of the extreme zones. This usually happens at moments when the market slows down for a long time. In this case, it is necessary to use additional filters.
The easiest way to filter Standard Deviation signals is to add an ordinary Moving Average with a long period to the chart. At the same time, you should increase the period of calculation and the indicator itself. As a result, you will have a full-fledged trading strategy. The trades should be placed only at moments when the signals of the Moving Average and the indicator completely coincide.
Filtering signals with the help of RSI
Another option for filtering the signals is the use of the RSI oscillator. In its settings, you should add an additional level 50, as well as remove the check mark from the item "fixed minimum/maximum". The period of the curve is 5 bars.
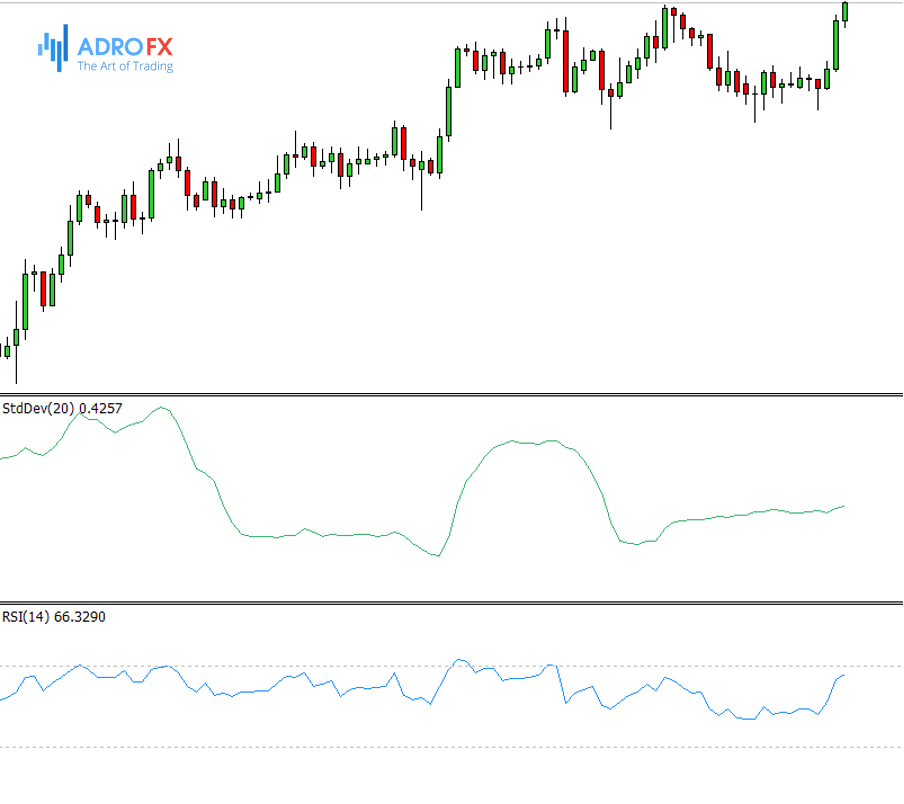
This method allows you to enter the market at the very beginning of the trend when a new trend is just emerging. If the trend has been formed for a long time, the filtered signal will be a price above (if it is a bullish trend) or below (if it is a bearish trend) the 50 level of the RSI indicator.
Filtering signals with the help of Bollinger Bands
Another effective filter for the Standard Deviation indicator is the platform's built-in tool – Bollinger Bands. It plots 3 Moving Averages on the chart, which form a price channel. The extreme lines are the boundaries of the channel and the conditional overbought/oversold areas. The central line shows the basic direction of the market.
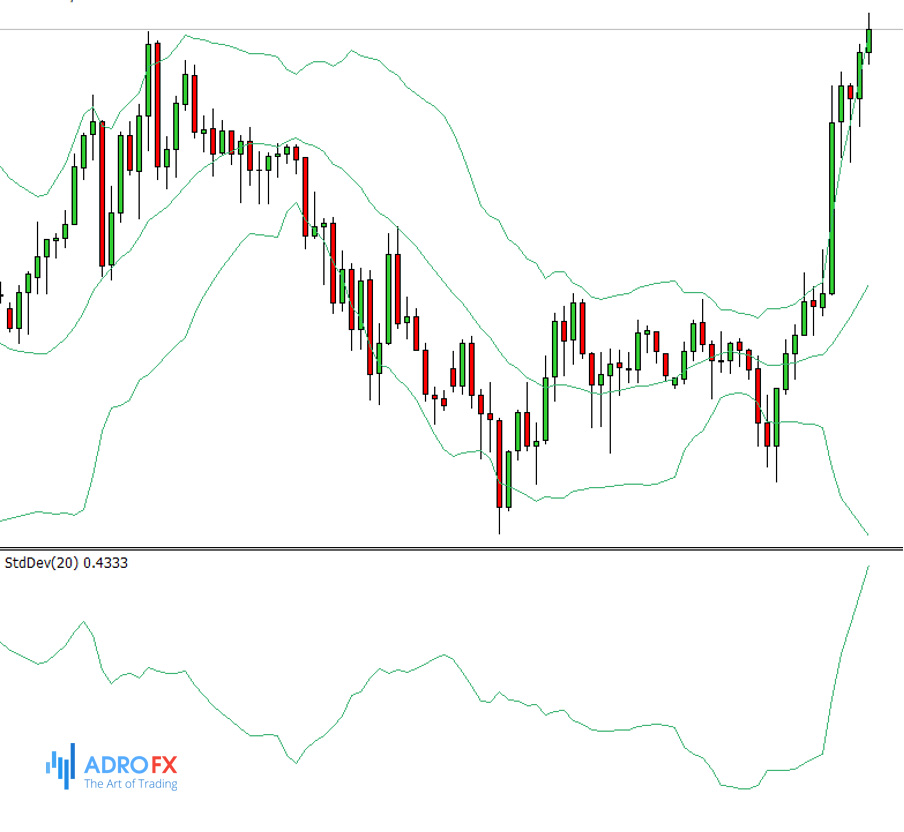
You can trade with the BB and Standard Deviation at the moments of a pronounced trend on the market. During a flat condition, it is better to postpone the opening of trades.
To determine the state of the market, pay attention to the Standard Deviation. If its curve is near the 0 level, it indicates a calm market (flat). As soon as the curve starts to rise above its maximum values - we can judge the emergence of a new trend. At the same time, the Bollinger channel should expand.
You can open a trade at moments when the price is at one of the boundaries of the Bollinger Band channel and the deviation indicator tends to the 100 mark. In this case:
- If the price is near the lower boundary of the Bollinger Bands, then you should open a long position.
- If the price reaches the upper border of BB, it is possible to open a short position.
- The order should be closed when the Standard Deviation indicator begins to fall to the zero level, or when the price touches the opposite boundary of the Bollinger channel.
- Stop Loss is set according to the usual scheme - at local extrema.
The tool for calculating the Standard Deviation is a universal indicator for technical analysis of the chart. It does not give trading signals and does not show the trend direction. Its main task is to indicate to the trader the degree of volatility of the market and the strength of this or that market trend.
Peculiarities of Using Standard Deviation Indicator
The currency market is characterized by alternating states of rest and increased activity. At moments when Standard Deviation is close to the zero mark, the market is in a state of rest, and this stage will soon change – the market will become active. If the indicator is close to a certain level, we should expect activity to decrease soon.
These patterns, associated with changes in volatility, do not always reliably predict the subsequent change in price. That is why the indicator is often used as an auxiliary instrument for technical analysis.
Standard Deviation is not always used for the identification of the following market trend. Often it is used to find the best moment to place the order in the current formed trend.
The whole idea is to sell or buy the asset at the maximum or minimum values of the indicator. If the trend is growing, the price decreases. If the value of Standard Deviation has overcome the maximum extremum, it is worth opening a long position. In case of a downtrend, price increase, and overcoming the permissible range limits by the indicator, it is necessary to open a short position.
The main difficulty of this forex indicator, which is often faced by traders is the triggering of a Stop Loss order when the asset continues to grow with the price after it has reached the maximum price value. The formation of a classic Moving Average based on the Standard Deviation will help to solve this problem.
The МА formation period should be maximally long to smooth the fluctuations of the price. As a result, we will have a tool, which is able to determine the most optimal periods for opening long and short positions.
Pros and Cons of the Standard Deviation Indicator
The advantages of the tool can include the reliability of determining the current trend, the ability to use it together with different oscillators, and of course the ease of setting.
The disadvantages are the frequent generation of false signals, the low value of the indicator for analysis, as well as the inability to use it independently, without auxiliary tools and indicators.
Conclusion
The Standard Deviation indicator is not designed to determine the direction of the current trend. It only allows you to see the strength or weakening of the current trend. This indicator is a significant component of mathematical statistics. Even if you do not use it in trading, understanding its principle is important for every market participant, as this algorithm is common in trading and is present in all analytical programs.
In fact, it is a universal indicator of technical analysis. Even though it cannot be used independently, it works effectively when combined with other tools.
Thanks to this versatility, it can be used in trading on all financial markets. However, for a more successful trade, you should not forget about the use of fundamental analysis. This is because it studies the factors that create the price movement. Among these factors are the cash flows, the public sentiment, the interaction of markets with each other, the study of the supply and demand ratio, and others.

About AdroFx
Established in 2018, AdroFx is known for its high technology and its ability to deliver high-quality brokerage services in more than 200 countries around the world. AdroFx makes every effort to keep its customers satisfied and to meet all the trading needs of any trader. With the five types of trading accounts, we have all it takes to fit any traders` needs and styles. The company provides access to 115+ trading instruments, including currencies, metals, stocks, and cryptocurrencies, which make it possible to make the most out of trading on the financial markets. Considering all the above, AdroFx is the perfect variant for anyone who doesn't settle for less than the best.
Related Articles


Latest updates
Latest updates


Technical Analysis
Latest updates


