S&P 500 Rebounds on Tech Rally While Inflation Tempers Fed Rate Cut Expectations | Daily Market Analysis

Key events:
- Eurozone - Deposit Facility Rate (Sep)
- Eurozone - ECB Interest Rate Decision (Sep)
- USA - Initial Jobless Claims
- USA - PPI (MoM) (Aug)
- Eurozone - ECB Press Conference
- USA - 30-Year Bond Auction
The S&P 500 trimmed its losses on Wednesday, as a tech rally led by Nvidia helped offset declining expectations for a large interest rate cut by the Federal Reserve next week. This came after data showed a slight increase in core inflation last month.
The S&P 500 closed up 0.5%, while the Nasdaq Composite surged 2.1%. However, the Dow Jones Industrial Average dropped by 92 points, or 0.2%.
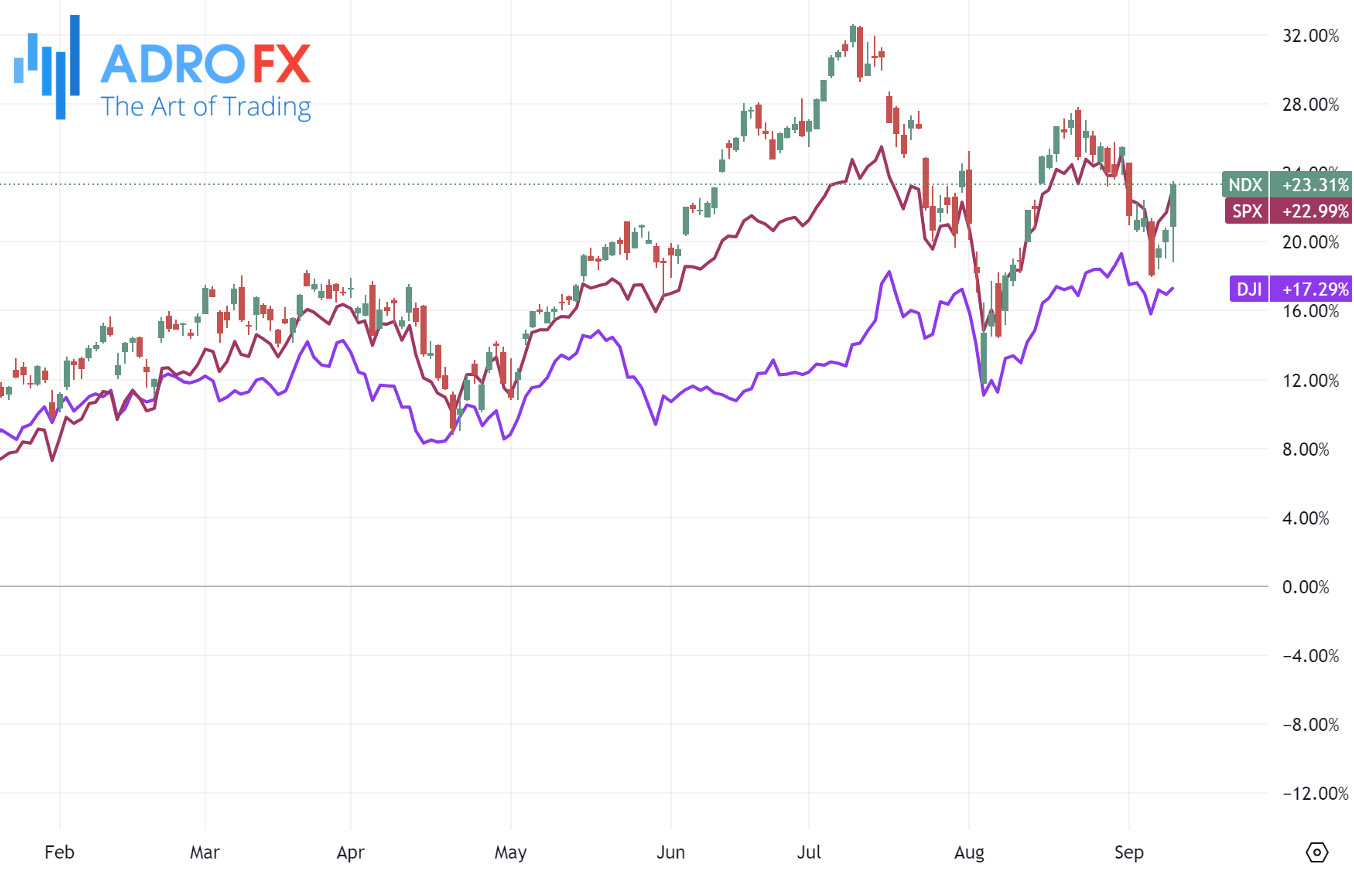
Nvidia (NASDAQ: NVDA) saw its stock jump more than 8% after reports surfaced that the US government is considering lifting a ban that would allow the company to export advanced chips to Saudi Arabia. This news, reported by Semafor, pushed Nvidia higher, boosting other semiconductor stocks and the broader technology sector.
Meanwhile, headline US consumer prices rose 0.2% in August, matching July’s rate and meeting economists' expectations. The annual headline inflation rate slowed to 2.5%, down from 2.9% in July. However, core consumer prices, which exclude volatile items such as food and fuel, increased by 0.3% on a monthly basis, slightly above the expected 0.2%. Year-over-year, core inflation remained steady at 3.2%, matching forecasts.
The slight uptick in core inflation has dampened hopes that the Federal Reserve will pursue a more aggressive interest rate cut at its upcoming policy meeting.
The USD/CAD pair attracted dip-buying during the Asian session on Thursday, temporarily halting its pullback from a three-week high near the 1.3620-1.3625 range, reached the previous day. However, the intraday uptick lacks strong bullish momentum, signaling the need for caution before expecting any significant upward movement.
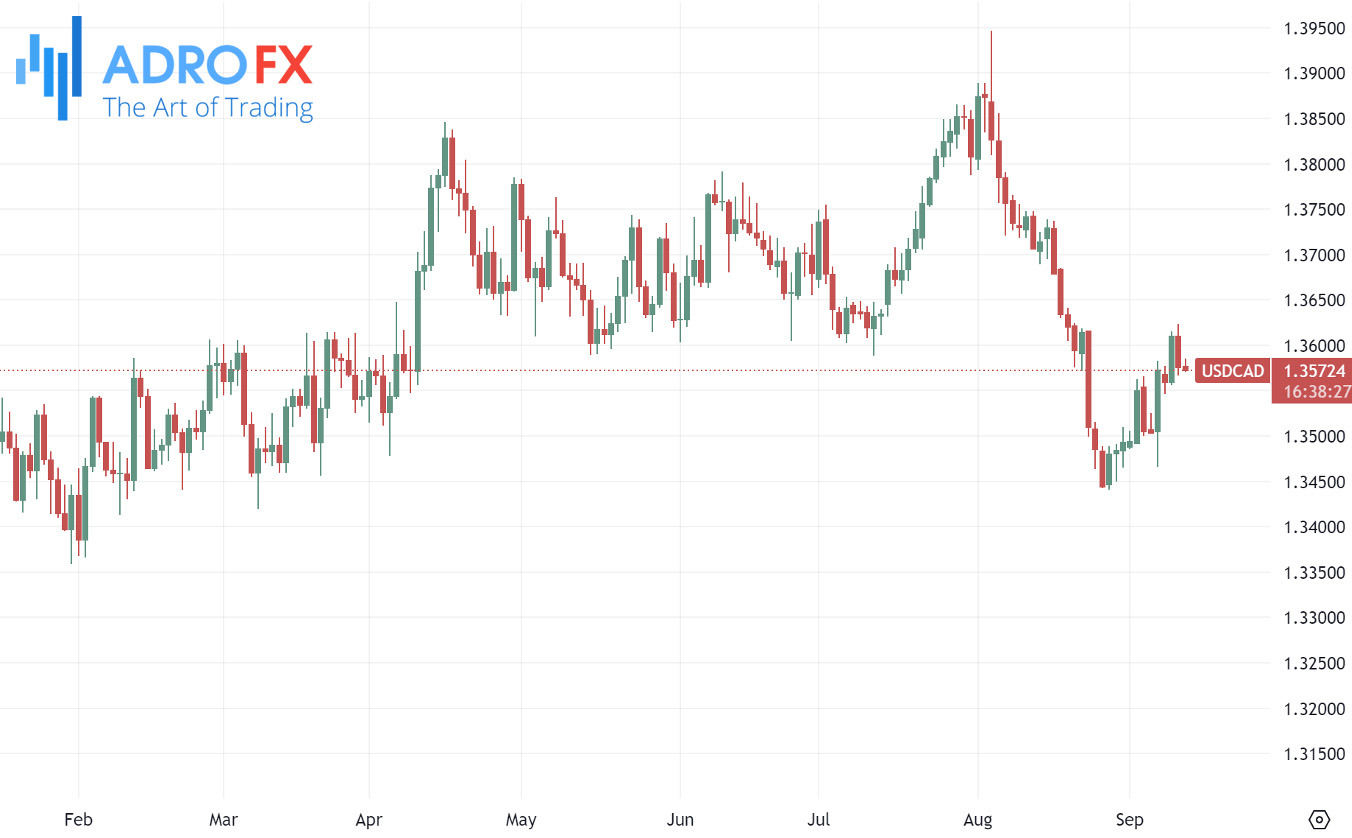
Meanwhile, the US Federal Reserve is widely anticipated to begin a policy easing cycle by lowering interest rates by 25 basis points at the upcoming September 17-18 meeting. This, combined with positive sentiment in equity markets, limits the appeal of the safe-haven US Dollar. Furthermore, a modest rise in crude oil prices supports the commodity-linked Canadian Dollar, contributing to capping gains in the USD/CAD pair. As a result, traders may want to wait for clear follow-through buying before placing bullish positions.
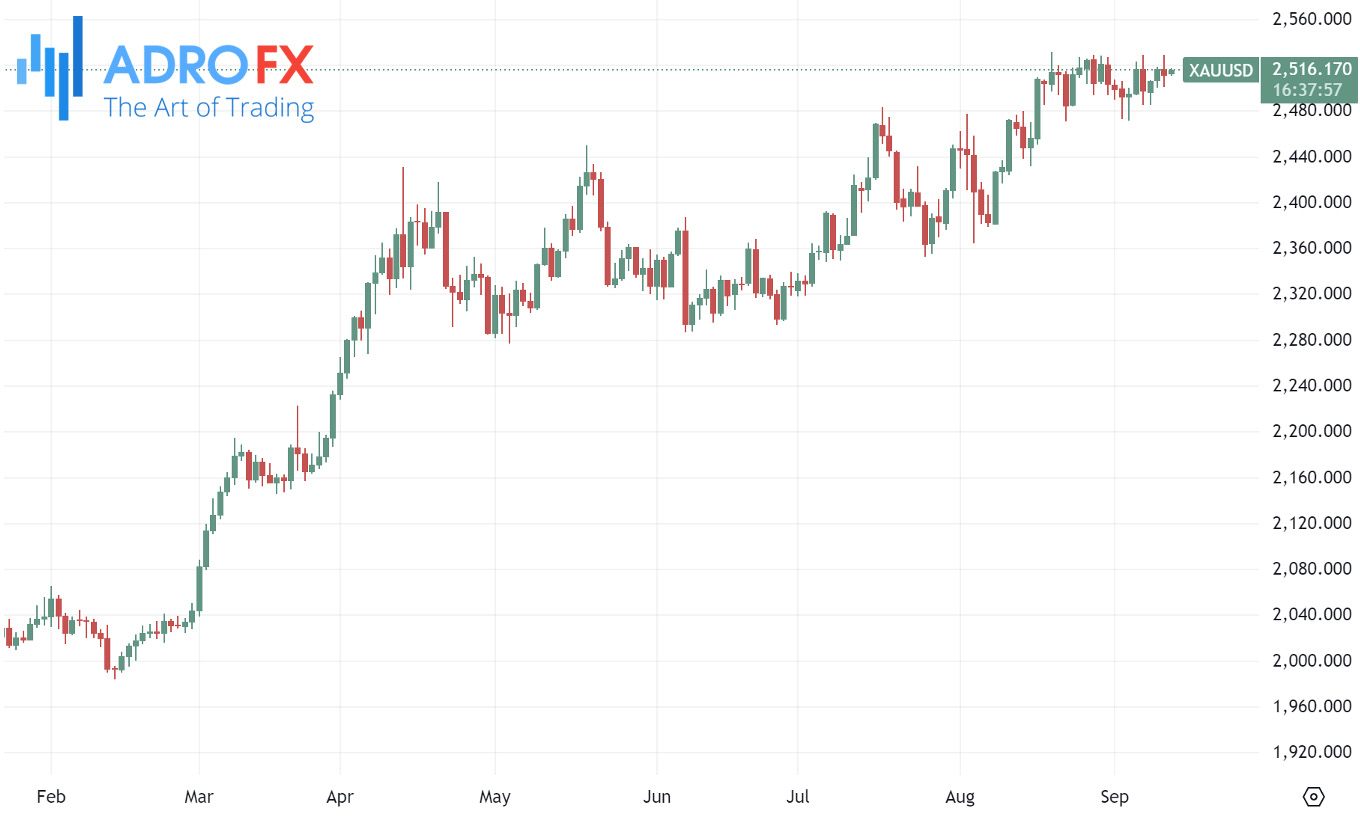
Gold prices saw an intraday pullback on Wednesday after US consumer inflation data reduced the likelihood of a more aggressive rate cut by the Federal Reserve in September. Additionally, the risk-on sentiment weighed on the precious metal, which ended lower for the first time in three days. Nonetheless, the expectation of an imminent Fed rate cut provided some support, helping gold rebound from the $2,500 psychological level. However, gold remains within a multi-week trading range, urging caution among traders before positioning for a decisive near-term direction.
The AUD/USD pair advanced after weaker-than-expected Australian Consumer Inflation Expectations were released on Thursday. Additionally, former Reserve Bank of Australia Governor Bernie Fraser criticized the current RBA board for focusing too much on inflation, potentially at the expense of the job market. Fraser urged the board to cut interest rates, warning of "recessionary risks" that could harm employment.
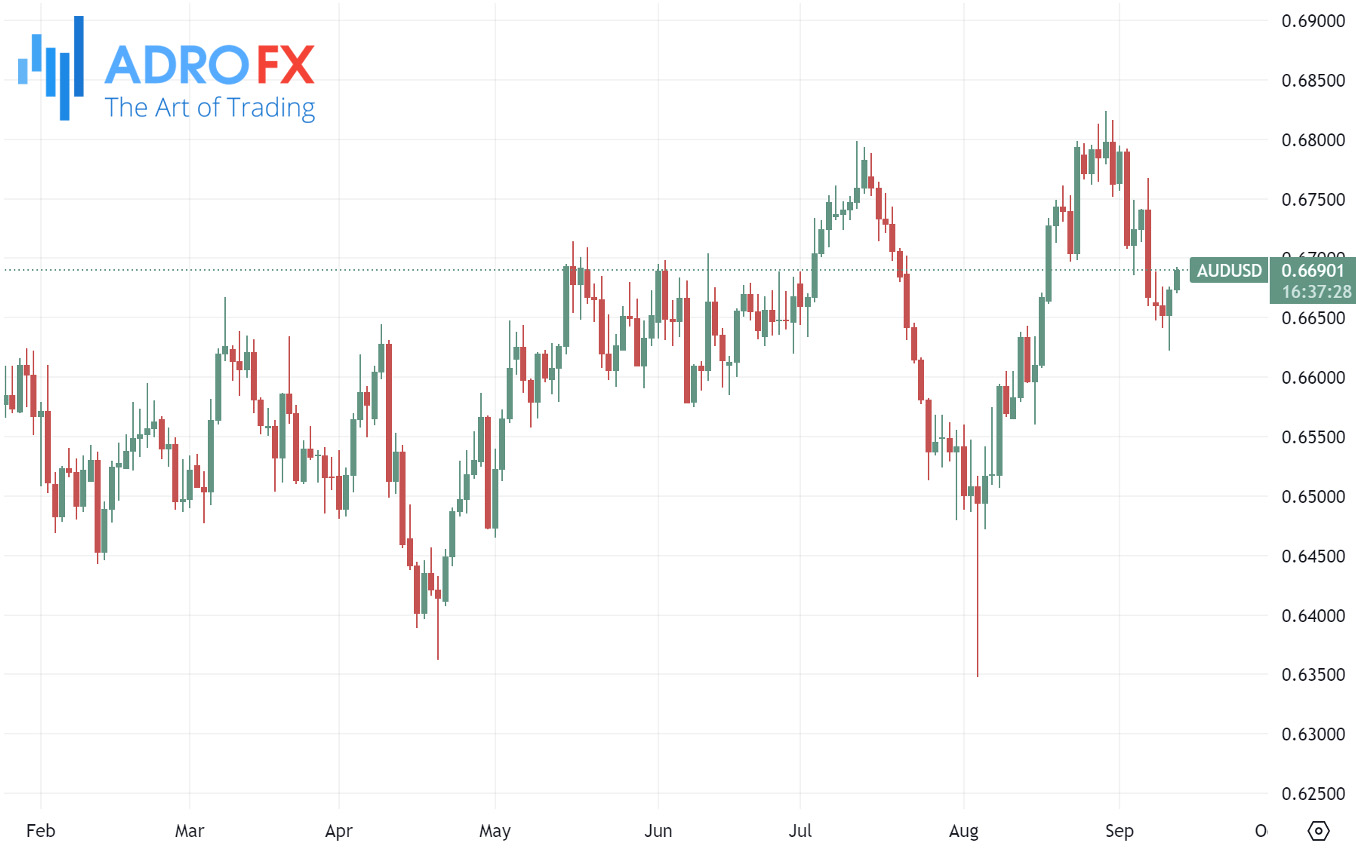
The Australian Dollar gained traction against the US Dollar following the release of the US inflation report, which bolstered risk sentiment. On Wednesday, Sarah Hunter, Assistant Governor for Economics at the RBA, noted that high interest rates were dampening demand, likely leading to a mild economic slowdown. However, she mentioned that the labor market remained tight, with employment growth expected to continue, albeit at a slower pace than population growth, according to Reuters.
Meanwhile, the USD/JPY pair failed to sustain modest gains made during the Asian session around the 143.00 mark and stalled its recovery from a nearly nine-month low reached the previous day. Prices are currently trading in the mid-143.00s, near the lower end of the daily range, and seem vulnerable to continuing the downtrend seen over the past two months.
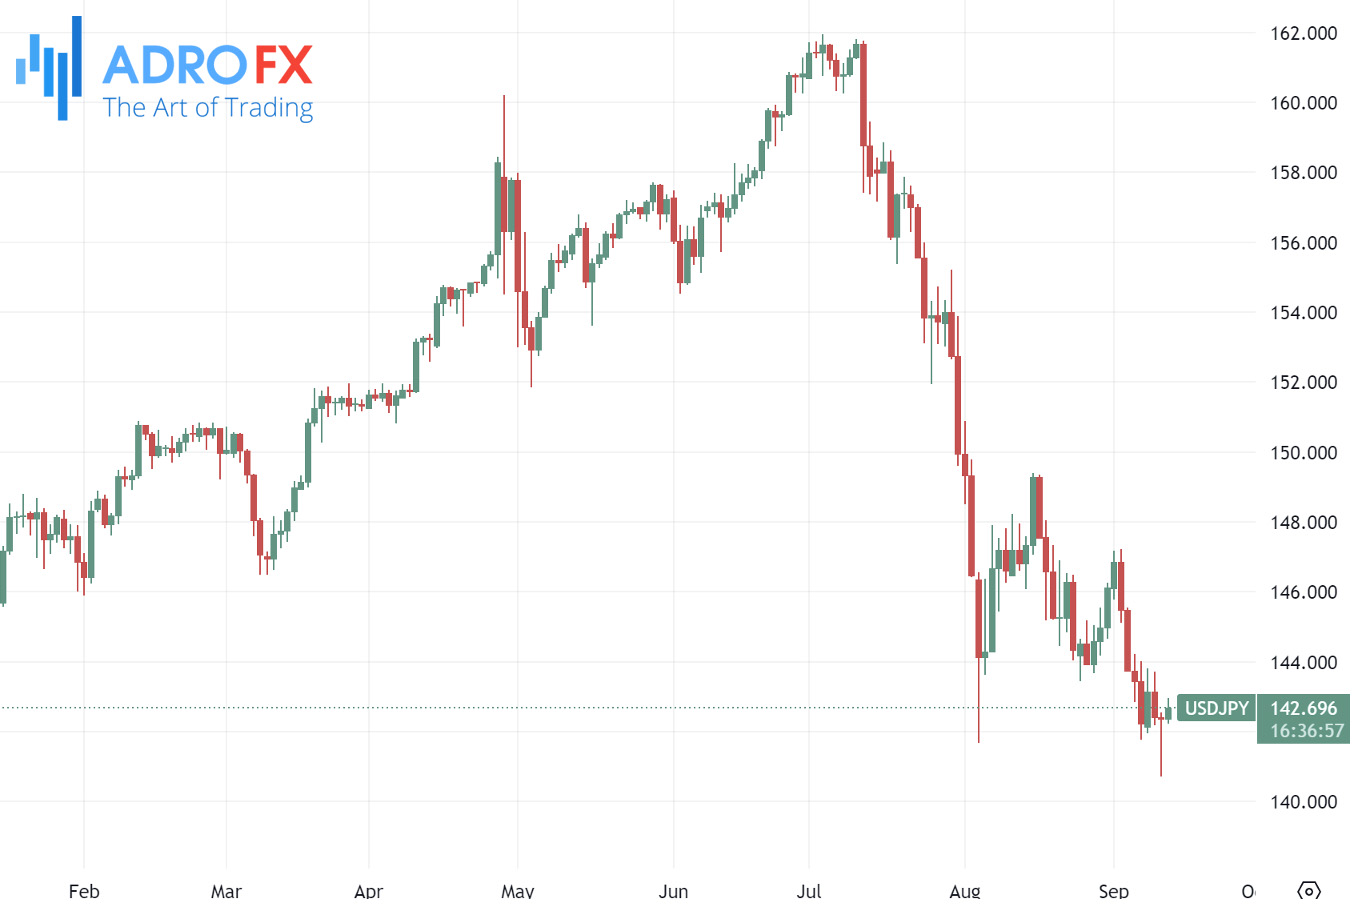
The Japanese Yen was further pressured by an unexpected decline in Japan's Producer Price Index (PPI), which fell by 0.2% in August. The annual rate also slowed to 2.5%, down from 3.0% in July. However, comments from Bank of Japan board member Naoki Tamura, suggesting that the path to ending the easy monetary policy is still long, helped limit losses for the Yen, as markets continue to anticipate a potential rise in borrowing costs by the end of the year.
In contrast, markets have fully priced in a 25 basis point rate cut by the US Federal Reserve at the September 17-18 meeting, highlighting a stark divergence from the BoJ's stance. This divergence has contributed to fresh selling pressure on the USD/JPY pair, leading to an intraday pullback. Traders are now focused on the release of US PPI data for further direction, although the overall trend suggests that the USD/JPY pair's path of least resistance remains to the downside.
Related Articles


Latest updates
Latest updates


Technical Analysis
Latest updates


