Maximizing Trading Strategies: Unveiling the Power of the McClellan Oscillator

Mastering various technical indicators is essential for traders looking to elevate their indices and equities trading. Momentum indicators are particularly valuable as they help assess the strength or weakness of an asset's price action. Among these, the McClellan Oscillator stands out as a prominent tool for evaluating market sentiment and identifying significant shifts in the breadth of market movements. This article delves into the McClellan Oscillator, explaining its functionality, calculation, and application in trading. Additionally, it compares this oscillator with other technical indicators to provide a comprehensive understanding of its use in enhancing trading strategies.
Understanding the McClellan Oscillator
The McClellan Oscillator is a market breadth indicator designed to evaluate the net advances and declines of stocks within an exchange. It detects major shifts in market sentiment, often referred to as breadth thrusts, across various securities. This oscillator can be applied to stock exchanges such as the New York Stock Exchange (NYSE), NASDAQ, London Stock Exchange (LSE), and Deutsche Boerse. By doing so, it helps traders pinpoint which sectors are most influenced by equity rallies, thereby providing critical insights into the strength of price trends.
Developed in 1969 by Sherman and Marian McClellan, the oscillator has become an essential tool in technical analysis. It monitors the interplay between advancing and declining issues, making it especially valuable for longer-term traders, such as swing traders, as opposed to day traders.
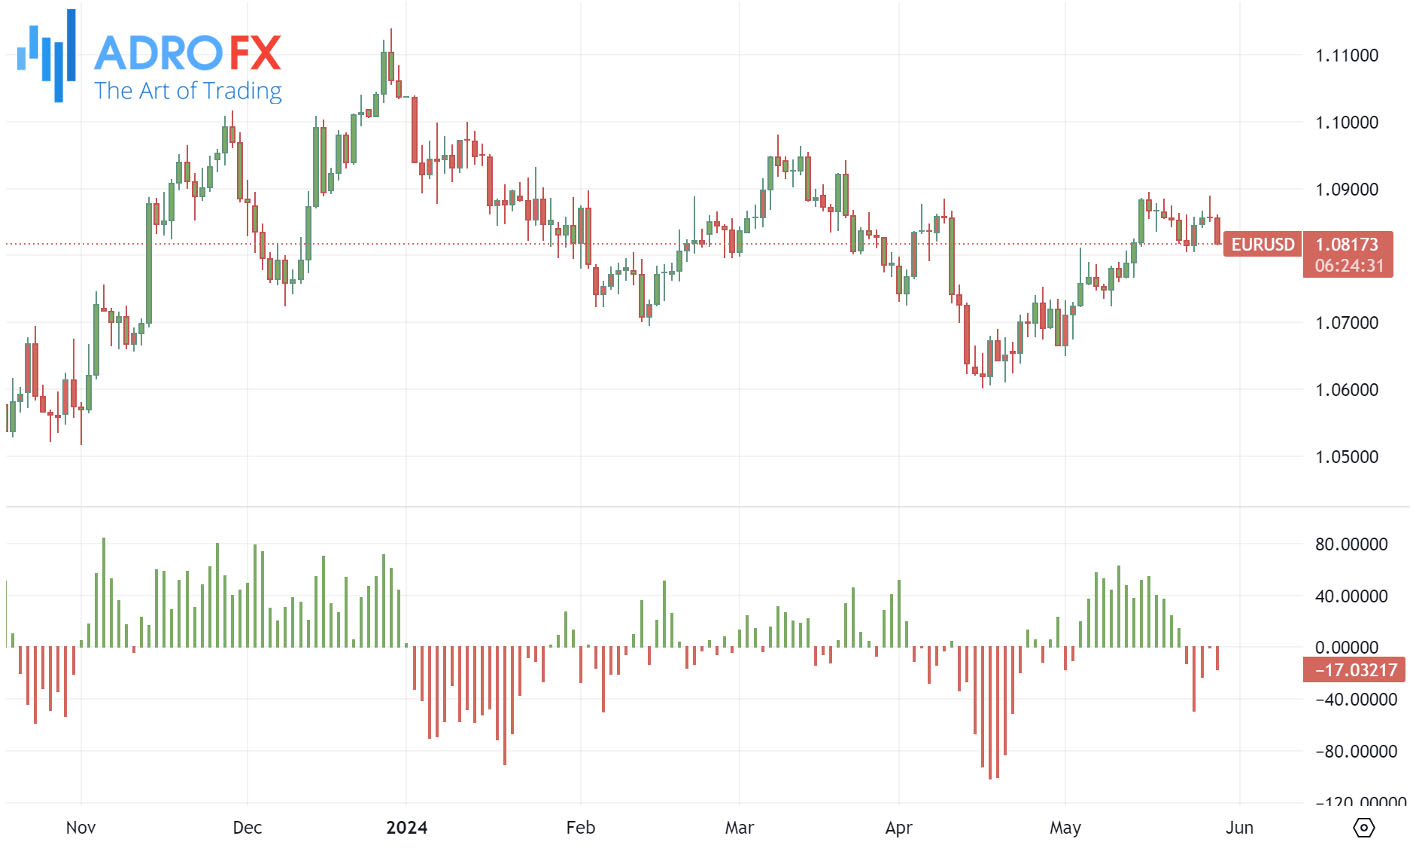
In the example below, the McClellan Oscillator is shown applied to Amazon Inc. stock prices on NASDAQ using Trading View. Overbought levels are highlighted in green and oversold levels in red in the bottom pane, with the oscillator fluctuating between +80 and -120.
Incorporating the McClellan Oscillator into your trading strategy allows you to better anticipate market trends and make more informed trading decisions.
How to Calculate the McClellan Oscillator
While the McClellan Oscillator is readily available on most trading platforms, delving into its calculation process can significantly deepen your understanding of its practical application. Let's break down the steps involved in computing the McClellan Oscillator:
Firstly, you need to assess the advances and declines within a stock exchange over both 19 and 39 days. The formula for the McClellan Oscillator involves subtracting the 39-day Exponential Moving Average (EMA) of advances minus declines from the 19-day EMA of advances minus declines.
To calculate the 19-day EMA, you would take today's advances minus declines, multiply it by 0.10, and then add the result to the previous day's EMA. Similarly, for the 39-day EMA, you would take today's advances minus declines, multiply it by 0.05, and add it to the prior day's EMA.
Once you've obtained these values, you can proceed to compute the final value of the McClellan Oscillator using the formula mentioned earlier.
It's important to keep your EMA calculations updated. For subsequent calculations, you should utilize the most recent McClellan Oscillator value for the Prior Day EMA and continue using EMAs instead of simple averages.
If you opt for the ratio-adjusted formula, the process remains quite similar, except you'll be using the Ratio Adjusted Net Advances (RANA) instead of simply Advances minus Declines.
Understanding the intricacies of the McClellan Oscillator calculation empowers traders to leverage its insights more effectively in their trading strategies, ultimately contributing to better decision-making in the dynamic world of financial markets.
Applying the McClellan Oscillator in Trading
The McClellan Oscillator stands out because it reflects the performance of all stocks within a specific exchange rather than just focusing on a single stock. This makes it particularly useful when used in conjunction with major indices like the S&P 500.
When the McClellan Oscillator shows positive values, it indicates that the 19-day EMA is above the 39-day EMA, suggesting a bullish trend. Conversely, negative values imply that the 39-day EMA is above the 19-day EMA, indicating a bearish trend. The oscillator's function is similar to the MACD indicator, as it relies on the relationship between short-term (19-day) and long-term (39-day) EMAs. It crosses the zero line whenever these EMAs intersect.
Interpreting the signals from the McClellan Oscillator involves looking at its position relative to zero. A value above zero, combined with positive advancing issues, signals a buy, suggesting that prices are likely to rise. In contrast, a value below zero, coupled with negative declining issues, signals a sell, indicating a bearish trend.
The color indicators also provide visual cues. When the oscillator is positive and green, it reflects buying pressure and a bullish market. When it is negative and red, it signals selling pressure and a bearish market. A strong market trend will generally move in the same direction as the McClellan Oscillator, whereas a weak trend will diverge from it.

Understanding Breadth Thrusts
Breadth thrusts are characterized by rapid and significant movements in the McClellan Oscillator, often exceeding 100 points as it shifts from negative to positive territory. These movements frequently signal the beginning of a robust bullish trend, typically transitioning from below -50 to above +50.
However, not all breadth thrusts indicate an impending bullish trend; some may merely mark substantial lows. Therefore, it is advisable to use the McClellan Oscillator in conjunction with other indicators for a more accurate analysis. A bullish breadth thrust is more dependable if it follows a bullish divergence, demonstrated by a strong upward movement of the McClellan Oscillator from negative to positive. Conversely, a bearish divergence is validated by a pronounced downward shift from positive to negative.
By mastering the use of the McClellan Oscillator and integrating it with other technical tools, traders can make more informed decisions and enhance their trading strategies.
Advantages and Disadvantages of the McClellan Oscillator
The McClellan Oscillator serves as a robust tool for traders, offering a comprehensive analysis of market dynamics by scrutinizing net advances and declines across entire stock exchanges. This detailed examination aids in identifying significant shifts in market trends and discerning overbought and oversold conditions, providing valuable insights into potential price reversals or trend continuations. Particularly advantageous for swing traders and those with longer-term trading horizons, it enables them to monitor and participate in broader market movements effectively. Moreover, the oscillator stands out in detecting breadth thrusts, rapid and substantial movements that often herald strong bullish trends, making it invaluable for traders aiming to leverage market momentum. By closely tracking the relationship between advancing and declining issues, it furnishes traders with a clearer understanding of market sentiment, empowering them to make well-informed decisions.
However, the McClellan Oscillator is not without its limitations. Its tendency to generate numerous trading signals due to frequent crossings of moving averages can introduce signal noise, leading to inaccuracies or unactionable signals. To bolster the reliability of these signals, it's often necessary to complement the oscillator with other technical indicators such as moving averages, the Relative Strength Index (RSI), or additional market breadth indicators. Additionally, understanding and computing the McClellan Oscillator may present challenges for novice traders, necessitating additional effort to grasp its calculation process. Its reliance on the performance of all stocks within a specific exchange also constrains its effectiveness in analyzing individual stocks or sectors without considering the broader market context. Furthermore, its susceptibility to market movements can sometimes yield false signals, especially in volatile or erratic market conditions, requiring thorough analysis and confirmation from other indicators before making trading decisions.
By carefully weighing these advantages and drawbacks, traders can enhance their comprehension of how to effectively integrate the McClellan Oscillator into their trading strategies, thereby improving their ability to anticipate market trends and make informed trading decisions.
Conclusion
In summary, honing expertise in momentum indicators is pivotal for traders aiming to refine their indices and equities trading approaches. Among these indicators, the McClellan Oscillator emerges as a standout tool for evaluating market sentiment and pinpointing significant shifts in market breadth. Throughout this discourse, we've delved into the workings, computation, and utility of the McClellan Oscillator, juxtaposing it with other technical indicators to furnish a holistic comprehension of its role in refining trading methodologies.
The McClellan Oscillator furnishes invaluable insights by scrutinizing the net advances and declines across entire stock exchanges, aiding traders in discerning market trend shifts and delineating overbought and oversold conditions. Particularly advantageous for swing traders and those with extended horizons, this oscillator excels in detecting breadth thrusts, often heralding the onset of robust bullish trends. Through the integration of the McClellan Oscillator with other technical tools, traders can elevate their decision-making acumen and fine-tune their trading strategies to harness market momentum.
Nevertheless, it's imperative to acknowledge the limitations inherent in the McClellan Oscillator, including the propensity for generating numerous trading signals and its susceptibility to market movements, which may occasionally yield false signals. To mitigate these constraints, traders are counseled to utilize this oscillator in conjunction with other technical indicators and conduct comprehensive analysis prior to making trading decisions.
By meticulously weighing the pros and cons delineated herein, traders can cultivate a deeper understanding of how to seamlessly integrate the McClellan Oscillator into their trading strategies, thereby augmenting their capacity to anticipate market trends and execute informed trading decisions.

About AdroFx
Established in 2018, AdroFx is known for its high technology and its ability to deliver high-quality brokerage services in more than 200 countries around the world. AdroFx makes every effort to keep its customers satisfied and to meet all the trading needs of any trader. With the five types of trading accounts, we have all it takes to fit any traders` needs and styles. The company provides access to 115+ trading instruments, including currencies, metals, stocks, and cryptocurrencies, which make it possible to make the most out of trading on the financial markets. Considering all the above, AdroFx is the perfect variant for anyone who doesn't settle for less than the best.
Related Articles


Latest updates
Latest updates


Technical Analysis
Latest updates


