Markets Navigate New Year with Stability and Positive Momentum | Daily Market Analysis
Key events:
- UK - S&P Global/CIPS UK Manufacturing PMI (Dec)
- USA - S&P Global US Manufacturing PMI (Dec)
- USA - Atlanta Fed GDPNow (Q4)
Overnight trading on Monday saw stock futures maintaining stability, setting the tone for the beginning of the new year. This follows a remarkably strong 2023, where the S&P 500 rallied by an impressive 24%. Dow Jones Futures and Nasdaq 100 Futures saw a marginal uptick of 0.1%, while S&P 500 Futures remained unchanged.
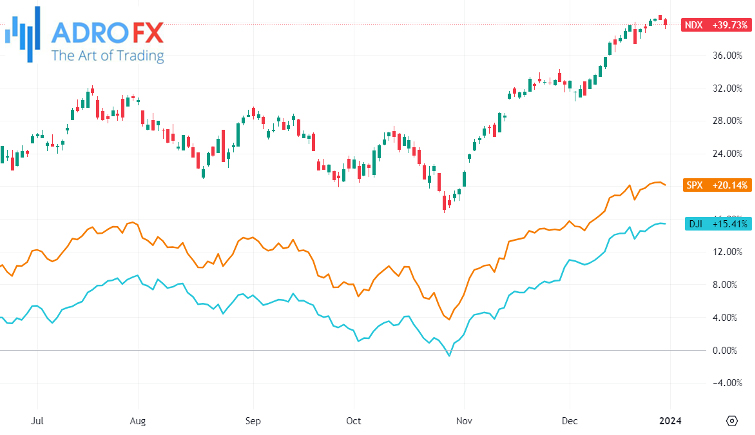
The culmination of 2023 witnessed the stock market ending on a positive note, with the S&P 500 experiencing a nine-week consecutive ascent, marking its most robust winning streak since 2004. Amidst this, risk assets enjoyed a notable relief rally, buoyed by the economy's resilience and a moderation in inflation. The Federal Reserve further contributed to the positive sentiment by signaling an end to rate hikes. However, the market had to navigate challenges, including a regional banking crisis and ongoing conflicts in Ukraine and the Middle East.
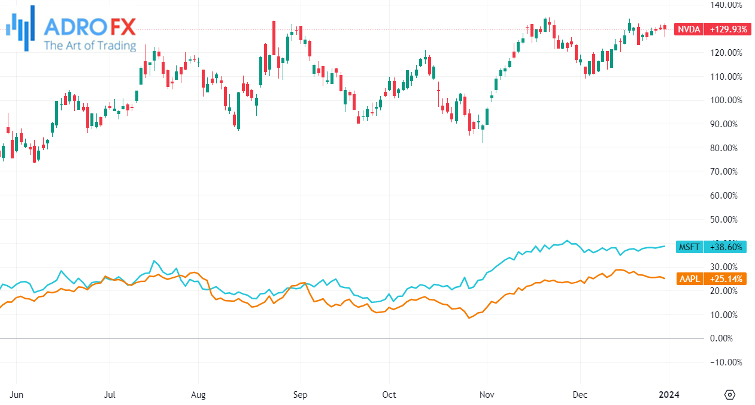
In the realm of technology shares, mega-cap stocks took center stage in the 2023 surge. Apple Inc (NASDAQ: AAPL) recorded a 48% surge, Microsoft Corporation (NASDAQ: MSFT) experienced a nearly 57% increase, and NVIDIA Corporation (NASDAQ: NVDA) saw a remarkable ascent of 239%. The tech-focused NASDAQ Composite closed the year with a substantial 43.4% gain, marking its most impressive performance since 2020. Meanwhile, the Dow Jones Industrial Average, a blue-chip index, notched a 13.7% gain and achieved a new all-time high in the course of 2023.
Despite the stellar performance in 2023, Wall Street strategists are anticipating significantly lower returns for stocks in the new year, as revealed by the CNBC PRO exclusive Market Strategist Survey. Forecasts from top strategists at major firms suggest that the S&P 500 is expected to end 2024 at 4,881, a modest 2.3% above Friday’s closing level of 4,769.83.
Analysts caution that the potential for an economic slowdown and subdued consumer spending may lead to slower earnings growth for businesses in the coming year.
The Gold price initiates the new year on a positive trajectory, recovering a significant portion of the losses incurred over the past two trading days. The precious metal maintains its modest intraday gains as it enters the European session, presently hovering around the $2,075 mark, reflecting an increase of over 0.50% for the day, albeit slightly below the multi-week high achieved last Thursday. Several factors contribute to this positive momentum, including the growing consensus that the Federal Reserve (Fed) is likely to commence interest rate cuts, potentially as early as March. Geopolitical risks and concerns regarding the fragile economic recovery in China also provide tailwinds for the non-yielding yellow metal.
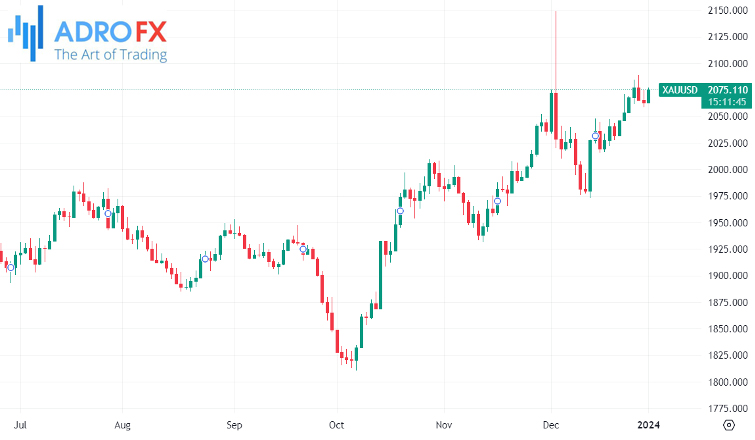
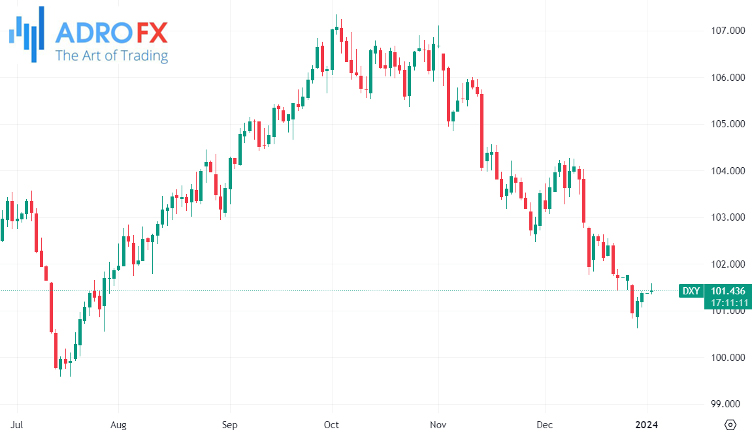
However, the ongoing recovery of the US Dollar from a five-month low witnessed last week, coupled with a rise in US Treasury bond yields, may act as a restraint on further Gold price gains. Market participants, exercising caution amidst relatively thin trading volumes, might opt to await the release of the FOMC minutes on Wednesday before making significant directional moves. The upcoming week's busy US economic schedule, featuring crucial macro releases at the start of the month, is expected to contribute meaningfully to influencing the precious metal.
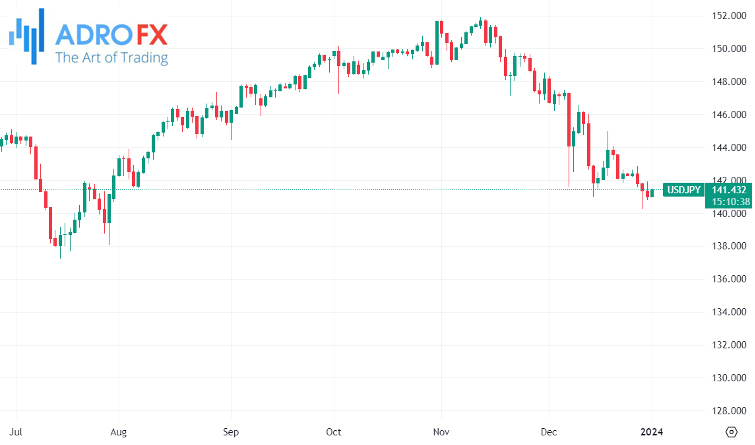
Concurrently, the Japanese Yen experiences a marginal decline against its American counterpart, propelling the USD/JPY pair beyond the mid-142.00s during the Asian session on Monday. The subdued trading volumes play a role in this movement. However, the anticipation that the Bank of Japan (BoJ) will depart from its ultra-loose policy and elevate interest rates into positive territory by the first half of 2024 is seen as a factor curbing losses for the domestic currency. Present market pricing indicates a strong likelihood of imminent action in April, post the annual wage negotiations in March, although the possibility of a move at the January meeting cannot be entirely dismissed.
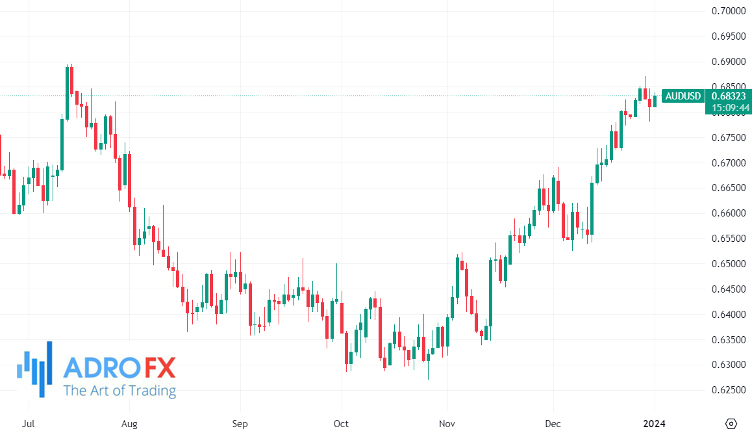
On Tuesday, the Australian Dollar hovers around 0.6820, consolidating its position after a rebound on Friday. Throughout 2023, the AUD/USD pair experienced a marginal decline of 0.06%, extending its three-year losing streak. However, in the last two months, the pair registered gains, attributed to a weaker US Dollar influenced by a recent dip in United States (US) inflation.
Australia's Dollar has displayed resilience, driven by an augmented risk appetite and robust inflation and housing prices. The recent meeting minutes highlight the Reserve Bank of Australia's (RBA) commitment to thoroughly assess additional data to gauge the risk balance before making decisions on future interest rates. The prevailing anticipation that the RBA is likely to abstain from a rate cut in the upcoming February policy meeting provides additional support for maintaining the strength of the Australian Dollar.
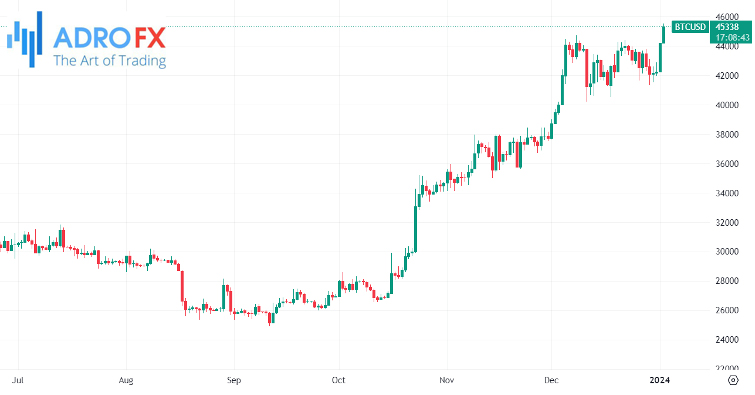
On Tuesday, Bitcoin surged to a 21-month high, experiencing a notable uptick amidst heightened speculation surrounding the potential approval of a spot exchange-traded fund (ETF) by the US Securities and Exchange Commission (SEC) for the world's largest cryptocurrency.
Bitcoin saw a remarkable 6% rise, reaching $45,168.6, marking its highest level since early April 2022. Notably, trading volumes remained subdued due to the ongoing New Year holidays.
This surge in Bitcoin's value extends the impressive recovery it witnessed in 2023, where the cryptocurrency's value surged by over 100%, starting the year at around $17,000.
The recent gains in Bitcoin can be attributed primarily to speculation surrounding the potential approval of a US ETF that directly tracks the token's prices. The SEC faces a January 10 deadline to either approve or reject a spot ETF application from Ark and 21 Shares, as reported by Reuters. The outcome of this ruling could establish a precedent for ETF applications from various other fund managers seeking approval for similar products.
Related Articles


Latest updates
Latest updates


Technical Analysis
Latest updates


