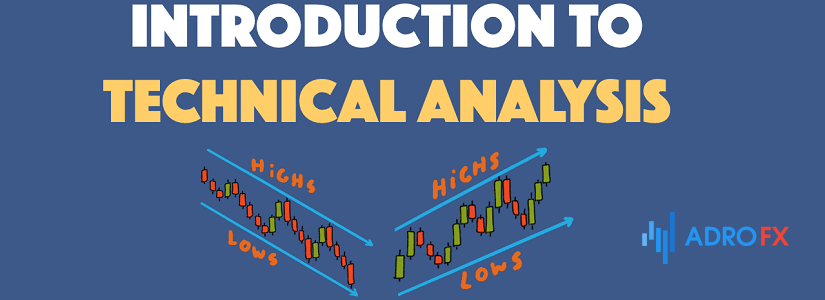
Introduction to Forex Technical Analysis Explained 2022
To benefit from price fluctuations on forex, you need to be able to research the market. Understand where the price is going, and based on that, decide whether to enter the game or wait for more favorable conditions.
That's what all traders do, not just on forex. A farmer who sells milk knows that if he goes to the market on a sunny Sunday afternoon, he will sell more, and at a better price than on a rainy Monday. He knows that good weather and a day off are two factors that will increase the demand for his product because there will be more people in the market.
In the same way, trading has its factors that indicate whether you should enter the market now or better another day.
Predicting price movements allows traders to protect themselves from unsuccessful trades and save funds for a better financial situation. They work with price movements on the chart and learn to find patterns in this process.
What is Technical Analysis?
Technical analysis is a way to predict the price movement. And, and this is just great - any price. And even more - any chart in the world. This method can even successfully predict ... air temperature and make weather forecasts. And no, this is not a joke.
But the main use of technical analysis is, of course, the markets. It is for them that this technology was invented. For several hundred years millions of traders have been looking smart and trying to figure out where the price is headed.
How else could it be? If you're a rice trader at an ancient stock exchange, you need a way to predict when you can get rich and when you should avoid the market. It doesn't matter that it's the 18th century and the telephone is 200 years away from being invented.
The first obstacle is the word "technical", which often scares people away. The name is very unfortunate. For when you dig under the hood of a car, is it not less "technical analysis" of a certain mechanism? Yes, it is.
But things are different with technical analysis in market betting, forex, or the stock market. Here the analyst works with the price movement on the chart and learns to find all the necessary patterns of this process.
You should know that technical analysis is not as simple as it seems. Your predictions will not always be correct. Learning technical analysis will take time and constant practice.
Sometimes you may hear that technical analysis is more of an art than a science. This is true because when we try to predict future price movements using technical analysis, there can be many nuances that can sometimes lead to different conclusions.
The Origins of Technical Analysis
It's much older than you might think. Let's say that some provisions of technical analysis were developed by Joseph de la Vega in the 17th century, for trading in the Dutch markets.
In the 18th century, Honma Munehisa, a Japanese rice trader, developed what later became the modern Japanese candlesticks. Just imagine - these candlesticks have been working for over 200 years.
The earliest mention of technical analysis dates to the late 19th century when Charles Dow published an article in the Wall Street Journal in which he laid out a series of principles which, in his opinion, could be used to enter buy and sell transactions without much risk. These principles later became part of the theory of determining the direction of the stock market. At this point, all talks on technical analysis faded away.
It was a blessing in disguise: the Great Depression broke out in 1929 and somewhat, strangely enough, it opened new horizons for technical analysts. At that time analysts had little work and a lot of free time, which they spent on discovering new theories of exchange science. That decade was marked by publications of such legendary stockbrokers as Elliott, Wyckoff, Gann, and many others. However, there was no unified vector of development: at that time some considered charts as graphical records of exchange supply and demand, while others were searching for a "secret order" in the exchange. The result of the research was the Elliott Wave Theory and the works of William Gann, who created a complex combination of geometrical-algebraic principles, which traders successfully used in the derivatives markets. It is the legendary thirties that gave birth to a constellation of stars of technical analysis, and it is not surprising - so strong was the influence of the Great Depression on brokers and analysts, that the best forces were thrown on development of the analytical forecasting.
The 30s of the last century, without exaggeration, can be called a golden period in the development of stock charts. But it would take years for technical analysis to become not just a set of tools, but an entire trading philosophy. With the appearance of computers in the 70s, technical analysis began to take a more mathematical form: analytical methods that use mathematical approximation and filtering began to rapidly develop. This is the time when the Wilder Directional System was created, which allowed to find trends and determine the expediency of work in their direction based on their speed, and a huge number of indicators, such as Williams' Percent Range, Joseph Granville's Volume Balance, and many others, the creators of which history is silent.
Almost half a century has passed, and the technical analysis never stops developing: new indicators are being developed, the number of "adepts" of this method is growing, and using technical indicators has never been easier!
Does Technical Analysis Work?
The undoubted convenience of this type of analysis is the fact that all the raw data necessary for its implementation is contained directly in the studied price chart. The postulate "the price discounts everything" reflects this fact in the best way.
Like any other prognosis, the conclusions based on the analysis of charts cannot be considered the ultimate truth. Their accuracy depends directly on the experience of the trader (analyst) who made them. In any case, it should be kept in mind that the technical analysis does not give an exact answer about where the price will move, it only tells about the probability of this or that direction of its movement.
The use of the technical analysis methods in trading by no means excludes the use of other forms of market analysis. In particular, the conclusions made on its basis can be complemented by the information, which the fundamental analysis can give to the trader. Or, vice versa, fundamental analysis conclusions can be used as an opportunity for a more detailed analysis of the current market situation with the help of technical analysis instruments.
Knowledge of the technical analysis basics is necessary for a practicing trader. It would be at least silly not to use in your work such a powerful layer of information about the current and future price trends, which can be obtained by using methods of technical analysis.
Fundamental Analysis vs Technical Analysis of the Financial Markets
Fundamental analysis is a method of measuring the intrinsic value of a security by examining interrelated economic and financial factors. In fundamental analysis, everything that can affect the value of a security is studied: macroeconomic factors (the state of the economy and the state of a particular business industry) microeconomic factors (the effectiveness of company management).
An investor's ultimate goal is to know the value, which can be compared to the current value of the security. This way the investor will see whether the security is undervalued or overvalued. Subsequently, the trader decides to buy/sell stocks.
This method is the opposite of technical analysis. In technical analysis, a price vector is predicted based on historical market data (price and volume).
The main goal of fundamental analysis is to determine whether a stock is priced correctly in the market. Fundamental analysis is conducted considering macro and micro factors. This is how securities that have been mispriced (unfairly) in the market are identified.
To understand the fair market value, analysts study the general state of the economy and then the specific industry. Only after that do they move on to the performance of specific companies.
Due to the volatility of the financial market, it is not easy to make a fundamental analysis for any instrument. Under different conditions, the same macroeconomic indicators affect the outlook in different ways.
With any significant economic or political event immediately after the publication of news the rate of the dependent currency pair usually rises or falls. And on this movement, regardless of the cause, you can attain some yield. The main thing is to keep abreast of events and be able to react to them quickly.
As a rule, prices fall when there is bad news, and prices rise when there is good news. But the first reaction to the news is just a result of traders' "shaking out" the market. The exact price direction becomes known later when the price follows the trend set by the news.
Unlike technical analysis, where forecasts are made in low time frames, fundamental analysis allows you to make long-term forecasts for the coming weeks and months.
But only a general analysis of financial and political activity and economic situation in the country can help traders considerably.
Advantages of Technical Analysis:
Speaking about the benefits of technical analysis, we cannot but mention that it is easier to use than fundamental analysis. In the fundamental analysis of the financial markets, it is important to determine the current state of the economy of the country in question, but it is also crucial to determine the correlation between the development of the economies of the countries that are interdependent with it. It means that not only the economic condition of individual countries should be analyzed, but also to calculate their mutual influence, and only specialists-analysts can accomplish this task. In technical analysis only a graph of price and volume changes is considered; that is why even those who are not at all informed about political events and are not familiar with the economy of this or that country can learn how to use it perfectly.
The most impressive advantage of technical analysis is the ability to place stop orders. This is a very serious plus. Such, as it may seem, an elementary factor, has just incredible value for successful trading.
Precisely these advantages of technical analysis allow you to analyze the situation on the market in the current period so that there is an opportunity to find the most favorable point to buy or sell the currency. Because of this, technical analysis has become a universal tool that can be easily applied when trading on any financial market.
Disadvantages of Technical Analysis:
Here are some disadvantages of technical analysis:
Mixed signals
There will be times when your technical analysis tools will produce mixed or conflicting signals. For example, you may get a buy signal based on your analysis of support and resistance levels, but your MACD indicator may be pointing to sell.
Over-analysis
A condition in which traders over-analyze the market so thoroughly that it becomes difficult for them to make the right decision. This usually occurs when a trader is trying to reconcile all the factors, which rarely succeeds in real-time trading. In trading, we are dealing with probabilities, not certainties.
We have to act based on incomplete information
With the plethora of technical tools available to traders, some fall into the trap of overanalyzing and failing to make trading decisions. The best solution to this problem is to try to keep things simple.
Our market analysis can be influenced by other factors
Although technical analysts rely on price as their primary analysis tool, certain biases can affect how they perceive the information they gather from charts. For example, if you have a bullish bias in EUR/USD, you will subconsciously look for and check out buying opportunities while ignoring signals that indicate EUR/USD is weakening. That's why it's crucial to try to analyze the charts in a truly unbiased way.
Interpretations can change
As we wrote earlier, technical analysis is more of an art than a science. Two technical experts can look at the same price chart and sometimes offer two opposing interpretations. This is not uncommon, and one of the culprits is our internal biases. Also, chart patterns that seem clear in hindsight can be very subjective in real-time.
Advantages of Fundamental Analysis:
Let's look at some advantages of using the fundamental analysis:
Helps explain price movements
Major economic news and reports can quickly influence market prices in one direction or another. This is especially true when economic release data is unexpected or significantly different from expected data.
Provides insight into global markets
Using a fundamental approach to analysis helps the analyst better understand what is happening in a particular country's economy and other countries around the world. It provides an in-depth understanding of global markets.
Estimates fair value
Every financial instrument or asset has a fair value associated with it. A trader's job is to find assets where there may be a mismatch between the true value of the asset and the market price.
Fundamental analysis can help the currency analyst in this regard by examining interest rates, inflation, consumer sentiment, industrial production, and other indicators.
Disadvantages of Fundamental Analysis
Fundamental analysis does not consider many factors, which can have a real impact on the price fluctuation. Therefore, the price movements can often go contrary to the fundamental analysts' forecasts. Every trader can see this after having traded for several years. And it is especially evident during crises and global trend reversals.
The fundamental analysis cannot determine the strength of the trends, even if it guesses their direction because it depends on the correlation of supply and demand on the market. And this question cannot be answered by fundamental analysis.
Using the methods of fundamental analysis requires a rather profound knowledge of finance and economics, accounting statements of companies, etc. Not every person can conduct this type of analysis. That is why most traders must rely on the recommendations of experts. And here is where another big problem arises which all investors face. It is related to the inconsistency of recommendations made by various analysts who may quite often disagree on price forecasts for the same financial instrument. This is because different analysts may use different ways to determine the fair value of a stock. In this case, the results may differ from each other very much.
In this case, the investor must intuitively choose a recommendation which in his opinion will be successful. And this is nothing but simple guessing, not much different from playing roulette or betting on a sport. Especially if the investor does not have sufficient financial and economic knowledge. Such an approach can periodically give beneficial results but does not allow achieving stable high success rate for many years.
On a growing market, this usually does not create much of a problem. In this case, most recommendations turn out to be beneficial . Problems arise when global trends reverse, for example, due to financial, economic, or political crises. The experience of previous crises shows that in these situations, most of the analysts' recommendations turned out to be extremely unsuccessful. As a result, there is one more serious problem of traders' psychology - they stop trusting recommendations out of fear of getting another loss. And this generally normal psychological reaction creates a kind of trap from which it is difficult to escape.
Which to Choose: Fundamental or Technical Analysis?
You now understand both types of analysis. The legitimate question is: Which one works better? Neither of them!
Each of these types of analysis has its strengths and weaknesses. Ignoring fundamental analysis often causes news events to dramatically change price movements when you are not expecting it. Without the use of technical analysis, you will not be able to find the best entry points on the charts and mark the levels where most trader activity occurs and price reverses frequently. Therefore, you need to find a balance between the two types of market analysis.
Using fundamental analysis can lead to a diverse portfolio that is risk-averse and highly efficient.
Fundamental analysis is useful for both long-term investors and short-term traders, whether they are new to the world of finance or seasoned professionals. It is a necessary step before making any investments or trades.
Combining reliable fundamental analysis with advanced technical analysis techniques and proper risk management strategies can result in consistently successful trades and minimal losses.
Technical analysis provides additional security if, for whatever reason, circumstances suddenly change, or the initial research does not result in a successful choice.
For example, the stock market recently reached an all-time high and the economy was doing well. Then a coronavirus caused a major sell-off, and the economy faced a recession. Things can change quickly and Stop-Losses placed at key levels could have prevented serious losses.
In the past, for a long period, fundamental analysis was the only method to analyze the market. But then this situation changed, as the advent of computers allowed for simplified calculations, and technical analysis began to become more popular for most traders. Many large investment funds use computer modeling to determine entry and exit points. An increasing proportion of transactions in financial markets are made through automated trading systems.
This means that many of the biggest players in the market make their trading decisions based on computer algorithms. In fact, according to some estimates, computerized trading represents up to 70% of the volume on all exchanges today. Whether you like it or not, the price movement is now mainly subordinate to technical factors, and only partly to fundamental ones. The markets are constantly changing, and you need to modify your trading strategies accordingly.
There is no right or wrong answer here. You should try both approaches and see what works best for you.
Technical Analysis Basics
The main three postulates on which, as on the three whales, stands the technical analysis of the forex market, as well as any other financial markets, are:
- Price action discounts everything;
- Price moves in trends;
- History repeats itself.
Let us go through each of them in detail.
Price action discounts everything
This statement is, in fact, the cornerstone of all technical analysis. The technical analyst believes that the reasons that somehow can influence the market price of the futures contract (and these reasons can be of different nature: economic, political, psychological - any), will be reflected in the price of this commodity. It follows that all that is required from you is a careful study of price movements. It may sound excessively biased, but if you think about the true meaning of these words, you will realize that it is impossible to refute them.
Price moves in trends
The concept of a trend is a fundamental one in technical analysis. It is necessary to understand that, in fact, everything that happens on the market is subordinate to certain trends. The main purpose of graphing price dynamics on the futures markets is to detect these trends at the early stages of their development and trade in accordance with their direction. Most technical analysis methods are trend-following in nature, that is, their function is to help the analyst recognize a trend and follow it throughout its existence.
Two consequences follow from the assumption that price movements are subject to trends: the first consequence is that the tendency in action is likely to develop further and not turn into its own opposite. This corollary is nothing more than a paraphrase of Newton's first law of motion. Consequence two: the current tendency will develop until it begins to move in the opposite direction. This is another formulation of the first corollary. Whatever verbal parabola may seem to us, it is necessary to remember firmly that all trend following methods are based on the fact that trading in the direction of the existing tendency should be carried out until the tendency shows any signs of turning back.
History repeats itself
Technical analysis and research of market dynamics are closely connected with the study of human psychology. For example, the graphical price models which have been singled out and classified during the last hundred years reflect important features of the psychological state of the market. First, they show what kind of mood - bearish or bullish - is dominating at present on the market. And if these models worked in the past, there is every reason to suppose that they will work in the future, for they are based on human psychology which does not change over the years. It is possible to formulate the last postulate - "history repeats itself" - in slightly different words: the key to understanding the future lies in the study of the past. Or you can put it another way: the future is just a repetition of the past.
Technical Analysis Charts
To carry out a qualitative analysis of the currency market and study its trends, it is necessary to choose the most convenient variant of price display on the chart. In addition to the personal preferences of the trader, this issue also considers the peculiarities of the trading strategy, by which he works. Let's consider what kinds of charts are "embedded" in the trading terminal and are located on the toolbar as a separate block:
Technical Analysis Line Charts
Initially, the technical analysis involved the use of simple charts. Later, it was replaced by a line chart, but like the tick chart, it was not very informative. It was difficult to determine the range of price changes, which did not allow carrying out a thorough visual analysis. The line chart uses two axes for drawing:
a) Vertical - shows the value.
b) Horizontal - shows the duration over time.
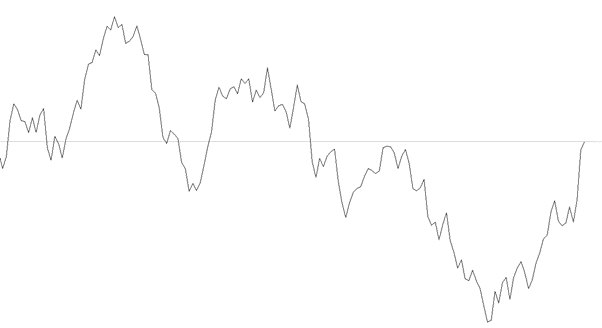
The line chart is based on points, fixing the value of the price at a certain point in time. Its disadvantages are the absence of other useful information, such as maximum/minimum price index, data about how exactly the price was changing at a certain time frame, etc. Without special auxiliary tools, the method of technical analysis on this chart will be of little effect. But even with necessary tools, it will require more time for studying the market condition and price behavior.
Technical Analysis Charts OHLC (Bar Chart)
This type of chart was more often used by stock exchange players before the appearance of Japanese candlesticks. Like the "Japanese candlesticks", it shows four prices - "open", "close", "high", "low". It is visually represented by a straight vertical line with small horizontal dashes above and below it:
a) The line to the left is the "open" price.
b) The line to the right is the "close" price.
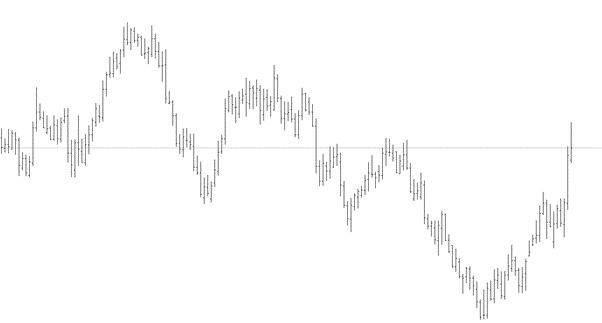
The bar chart is more informative; therefore the technical analysis is more useful here. It will allow you to make a deeper analysis of the market and, accordingly, will give better trading results. With its help, you can easily identify the dominant market trend:
Its disadvantages include the impossibility of conducting a quick analysis of the currency market on a large chart with a large number of bars. This task is better handled by the "Japanese candlesticks" chart.
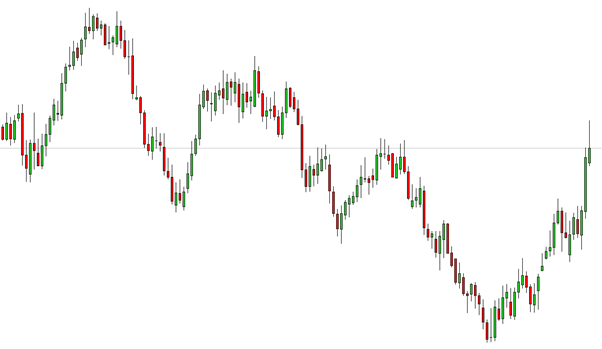
Technical Analysis Candlestick Charts
We owe its invention to the Japanese, so it is called - "Japanese candlesticks. This type of chart, like the "Bar chart", shows four types of prices, but visually it is more pleasing to the eye. Currently, the "Japanese candlesticks" chart is very popular among traders and is a successful addition to the system of technical analysis. The body of a "bullish" candle is colored green, and a "bearish" candle is colored red:
Technical Analysis Candlestick Patterns
There are many different candlestick patterns. Not all of them work equally well and often their definition is quite subjective. Therefore, one should not make trading decisions based on only one pattern. The best way is to combine them with support and resistance levels, moving averages or other technical analysis indicators which enhance market entry signals.
Over the years, Japanese traders have developed various candlestick patterns based on historical price movements. Every trader should invest their time and study these patterns, as it will give a deeper knowledge and understanding of charts in general. Candlestick patterns can help you interpret price movements in the market and make predictions about the immediate directional price movement for the chosen asset.
Although there are many different patterns, we will discuss some of the most popular ones that can help you learn to read charts like a professional trader.
Reading candlesticks can give us information about three market moods: bullish, bearish, or neutral.
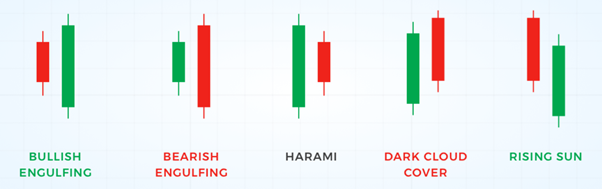
Once you master simple candlestick patterns, you can move on to more complex ones, such as bullish and bearish formations with 3 candlesticks.
The main difference between simple and complex candlestick patterns is the number of candles needed to form them. While a simple pattern, such as a hammer, requires one candle, more complex patterns usually require two or more candles to form.
For example, a bullish Harami pattern requires two candles, a Three White Soldier pattern requires three.
Again, remember that regardless of the complexity, the placement of all these simple and complex candlestick patterns is one of the most important aspects of chart reading.
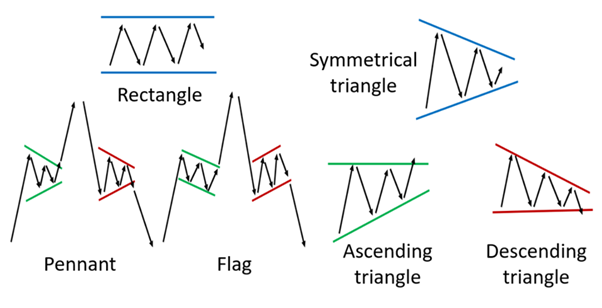
Technical Analysis Chart Patterns
Forex patterns are frequently repeated in the market price models, because of the formation of which there is a certain pattern of price behavior in the future.
In other words, trading patterns should give a percentage advantage in determining the direction of the subsequent price movement.
So how do you trade patterns?
It is not necessary to fanatically look for patterns on the chart - after a little practice, they are visible to the naked eye. Now for the most important thing: problems with patterns suggest that they don't make sense. But there is one point why we should necessarily draw the patterns on the chart - during the formation and working out of the pattern it is much easier to draw several scenarios of price behavior than to draw them on a bare chart without patterns. Let us explain: most people see the pattern and set their orders/stops according to its rules, creating a cluster of orders, and the price, as we know, moves from cluster to cluster, as a result, we have two scenarios - development of the pattern or its breakdown.
Basically, it is necessary to know the classics (for general educational purposes), but we should not trade in their pure form, while the signals for entry/exit should be sought in other more informative tools, such as an order book, correlation of traders' positions, volumes.
Why you should start using technical analysis with AdroFx today!
In case you're in search of a reputable trading platform that offers the best trading conditions, you`ve got to the right place! With AdroFx you have access to multiple markets, including forex, stocks, indices, cryptocurrencies, and metals. Moreover, you can benefit from the leverage of up to 1:500 and the compatible spread from 0.4 pips. Make the most out of technical analysis with the MetaTrader 4 and daily trading signals prepared by our analytical department.
The security of client funds is ensured by their storage on segregated accounts, separately from the company's funds. With the four types of accounts presented, there is something that will suit your style and financial goals.
Conclusion
Today hundreds of thousands of traders, if not millions, use forex technical analysis in trading, which makes it more attractive. In other words, it turns out that the more traders analyze the market using technical analysis, the better the forecasts on the real market will come true. Each trader approaches the technical analysis in his way. So, it is quite probable that two analysts will come to different conclusions regarding the price movement in the future. If you thoroughly study the basics of technical analysis for beginners, as well as all the nuances, it will help you not get confused in the indicator signals, levels, and charts at different time frames.
Related Articles

Latest updates
Latest updates


Technical Analysis
Latest updates


