Importance of Market Sentiment in Day Trading: Insights and Strategies
Market sentiment stands as a pivotal concept in the realms of day trading and investing. It encapsulates the prevailing collective outlook held by investors and traders regarding either the broader market or a specific asset.
While market sentiment alone isn't a comprehensive analysis tool, it serves as a crucial initial indicator that sets the tone for our day in the financial markets. Being aware of whether there's a prevalent bullish or bearish sentiment, as opposed to anticipating a breakout or reversal, can significantly influence our decision-making process.
In this article, we delve into the essence of market sentiment, shedding light on its significance, and explore some of the most widely utilized gauges employed to discern the prevailing sentiment within the market.
What Is Market Sentiment?
In the world of finance, market sentiment is akin to the heartbeat of the trading arena. It's the pulse that reveals the emotional undercurrents among investors and traders, shaping the trajectory of asset prices.
Picture a bright, optimistic day in the market, and you're witnessing bullish sentiment in action. This is when market participants radiate confidence, exuding positivity about a specific asset or the overall market. It's like a wave of enthusiasm that sweeps through traders, making them eager to buy, driven by the expectation of future gains. During these periods, it's as if the sun is shining on the market, pushing prices upward.
But, just as the weather can change abruptly, so can market sentiment. Enter the world of bearish sentiment, where pessimism clouds the horizon. Investors develop a gloomy outlook, fearing potential downturns in the market or specific assets. It's a dark cloud that hovers, leading to a cascade of selling as more and more participants anticipate future losses. In these moments, it's as if a storm is brewing, causing prices to tumble like raindrops.
What stirs these emotional currents in the market? It's a concoction of factors, a potent blend of economic data, geopolitical events, corporate news, earnings reports, and even the ripples of social media and news headlines. Investors and traders, often swayed by their emotions, react to these catalysts, molding and sculpting the prevailing sentiment like clay in the hands of an artist.
Amidst this emotional ebb and flow, there are those who march to a different beat – contrarian investors and traders. They defy the prevailing sentiment, charting their own course. When the crowd succumbs to bearishness, contrarians see an opportunity to buy low, believing that markets have a tendency to revert to the mean. Conversely, when the optimism reaches a fever pitch, they sell high, embracing a contrarian philosophy that challenges the herd mentality.
To gauge these emotional tides, analysts and investors employ an arsenal of tools and indicators. They conduct surveys to measure investor sentiment, dissect options market data, scrutinize put/call ratios, and scrutinize sentiment indexes. These instruments act as barometers, striving to quantify the elusive essence of market sentiment.
Yet, within the realm of sentiment lies a curious phenomenon – herd behavior. It's when many investors become a flock of sheep, following the crowd even when it may not be in their best interest. It's akin to a hypnotic trance that leads to exaggerated market movements, as the collective psyche drives traders to act in unison, sometimes against their better judgment.
And just like the changing of seasons, market sentiment has its cycles. In the short term, it can spark dramatic price swings, where emotions run high and sentiment-driven forces push and pull asset prices. But in the long term, fundamentals such as earnings and economic conditions tend to wield more profound influence, like the steady currents of a river that eventually carve the landscape.
In essence, market sentiment is the beating heart of financial markets, a force that can elevate or deflate asset prices, often guided by the ever-changing winds of human emotion and perception.
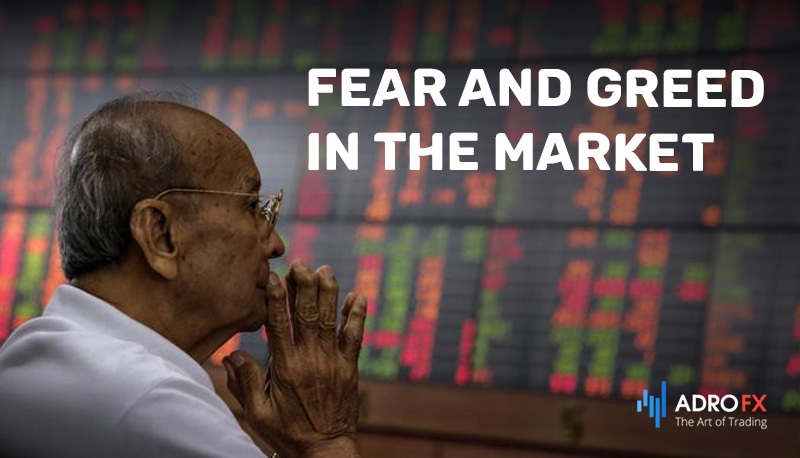
Fear and Greed in the Market
Fear and greed are the twin emotions that underpin the ebb and flow of market sentiment. They're the yin and yang of financial psychology, the forces that drive investors and traders to make decisions, often in irrational and unpredictable ways.
Fear, like a shadow that looms over the market, can paralyze even the most seasoned investors. It creeps in when uncertainty prevails, when economic indicators take a nosedive when geopolitical tensions escalate, or when unexpected events disrupt the status quo. In these moments, fear grips the market like a vice, causing panic selling, sharp declines in asset prices, and a rush to safety, often in the form of bonds or gold. It's as if a dark cloud has rolled in, obscuring the path ahead and leaving investors scrambling for cover.
Conversely, there's the powerful force of greed, the driving ambition to accumulate wealth and seek higher returns. Greed can be a formidable motivator, pushing investors to take on more risk than they should, often in pursuit of outsized gains. When greed takes hold, it's as if a fever has swept through the market, leading to speculative bubbles, overvalued assets, and a disregard for prudence and caution. It's the siren song that lures investors into risky ventures, often ending in tears when the bubble bursts.
Fear and greed often play a tug-of-war in the hearts and minds of investors. When fear dominates, investors seek the safety of low-risk assets, like government bonds, and may even exit the market altogether. But when greed rears its head, they become more willing to take on risk, chasing the allure of high returns.
These emotions are not only individual but also collective. The fear of missing out (FOMO) can drive investors to jump into the market when it's hot, fearing they'll be left behind. Conversely, the fear of losing everything can lead to a mass exodus from the market during downturns.
Understanding the interplay of fear and greed is crucial for market participants. It explains why markets can be so volatile, swinging wildly from exuberance to despair. It also underscores the importance of discipline, rational decision-making, and a long-term perspective in navigating the turbulent waters of the financial world.
In the end, fear and greed are the emotional currents that shape the ever-changing landscape of market sentiment. They are the hidden hands that guide the trajectory of asset prices, reminding us that, in the world of finance, emotions are as influential as data and analysis.
Top Sentiment Gauges
In the realm of market sentiment analysis, there are several powerful gauges and indicators that traders and investors rely on to navigate the complex landscape of emotions and perceptions. Here, we'll explore some of the top sentiment gauges:
1. VIX (CBOE Volatility Index): Often referred to as the "Fear Gauge," the VIX measures market expectations of near-term volatility. It reflects the degree of fear or uncertainty in the market.
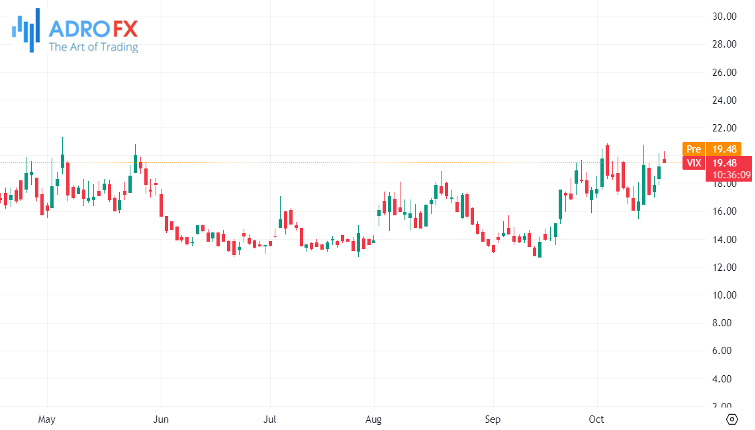
When the VIX is high, it indicates increased fear, suggesting potential turbulence and declining stock prices. Conversely, a low VIX typically signals complacency and confidence in the market.
2. Fear and Greed Index: This index is a composite measure that combines various market sentiment indicators to gauge whether investors are driven by fear or greed.
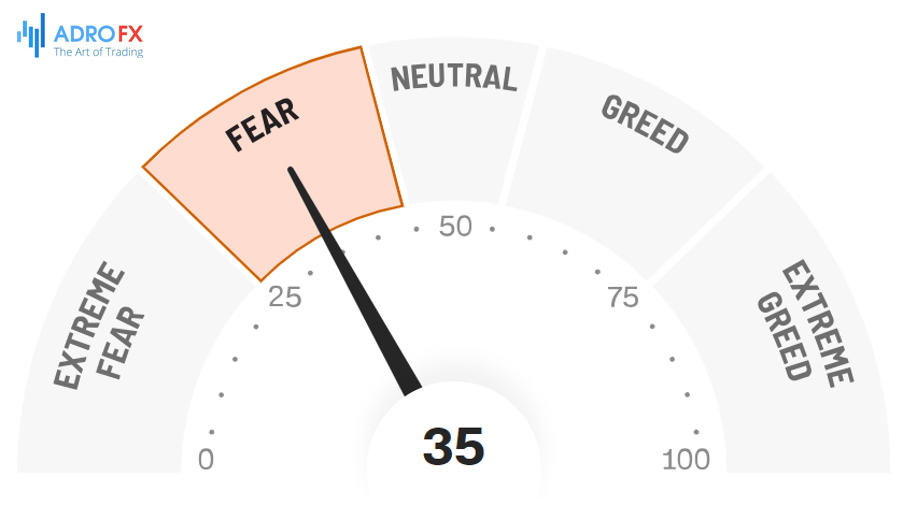
It takes into account factors like market volatility, stock price breadth, put/call ratios, and safe-haven demand. A high score on the Fear and Greed Index implies greed and may suggest an overbought market, while a low score indicates fear and could signal overselling.
3. Breadth Indicators: Breadth indicators measure the overall participation of stocks or assets in a market move. One common breadth indicator is the Advance-Decline Line, which tracks the number of stocks advancing versus declining.
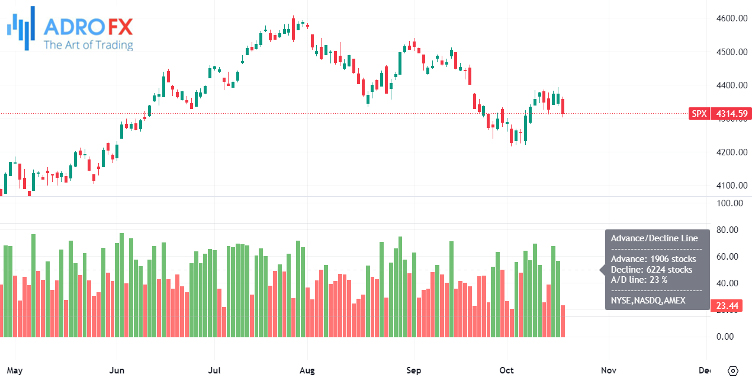
Strong breadth suggests broad market participation, indicating a healthy market sentiment. Conversely, weak breadth can signal narrowing market enthusiasm.
4. Oscillators: Oscillators are technical indicators that oscillate between specified levels. Examples include the Relative Strength Index (RSI) and the Moving Average Convergence Divergence (MACD).
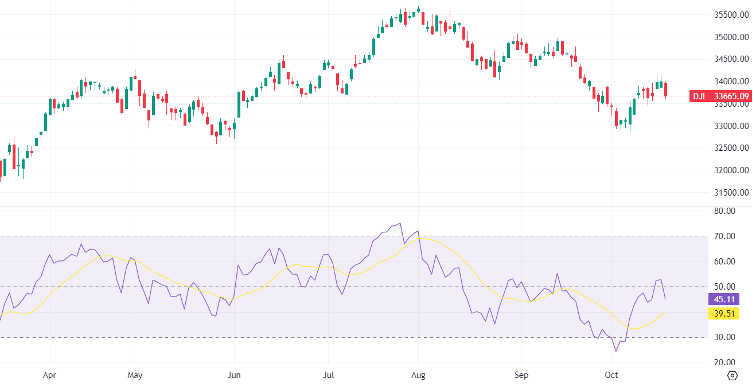
These indicators can be used to identify overbought or oversold conditions in the market, potentially signaling a shift in sentiment. When an oscillator reaches extreme levels, it may indicate a reversal in sentiment is imminent.
5. Put/Call Ratios: Put/call ratios provide insights into options market sentiment. A high put/call ratio suggests a more bearish sentiment, as investors are buying more put options (betting on price declines). Conversely, a low ratio indicates bullish sentiment, as investors are buying more call options (betting on price increases). Extreme readings can be indicative of sentiment extremes.
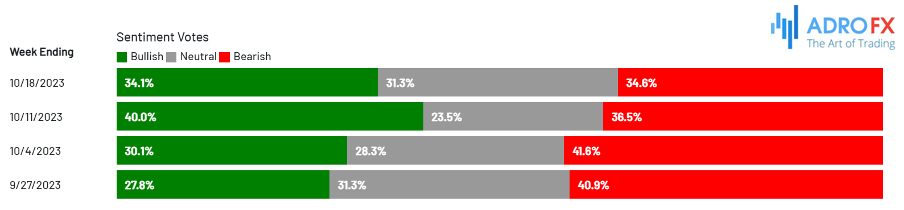
6. Sentiment Surveys: Various surveys and sentiment indices are conducted to gauge investor and trader sentiment. The American Association of Individual Investors (AAII) and the Investors Intelligence Survey are examples of these surveys. High bullish sentiment in these surveys can be a contrarian signal for potential market reversals.
Each of these sentiment gauges provides a unique perspective on market sentiment, and traders often use a combination of these tools to make informed decisions. However, it's essential to remember that sentiment indicators are just one piece of the puzzle, and they should be considered alongside other fundamental and technical analysis factors for a comprehensive view of the market.
How to Use Sentiment in Day Trading
Utilizing sentiment analysis in day trading can provide valuable insights and help traders make more informed decisions. Here are some strategies and tips on how to use sentiment in day trading effectively:
Real-Time News and Social Media Monitoring
- Stay updated with real-time news and events that could impact the market sentiment. Social media platforms like Twitter and financial news websites can be valuable sources of information.
- Pay attention to breaking news, earnings reports, economic indicators, and geopolitical events that can trigger sudden shifts in sentiment.
Sentiment Indicators
- Incorporate sentiment indicators like the VIX (Volatility Index), Fear and Greed Index, and other sentiment indexes into your trading analysis. These can provide a snapshot of overall market sentiment.
- Monitor put/call ratios, which can reveal options market sentiment and potential areas of support or resistance.
Sentiment Analysis Tools
- Use sentiment analysis tools and software that can help analyze social media sentiment, news sentiment, and sentiment trends related to specific stocks or assets.
- Look for patterns or trends in sentiment data that can provide insights into potential price movements.
Contrarian Strategies
- Consider contrarian strategies by going against prevailing sentiment when extreme sentiment levels are reached. For example, if sentiment is excessively bearish, it may signal a buying opportunity.
- Be cautious with contrarian strategies, as they can be risky, and it's crucial to combine them with other technical and fundamental analyses.
News Catalysts and Sentiment Correlation
- Identify key news catalysts that can drive sentiment changes. For example, a positive earnings surprise can lead to bullish sentiment, while a negative economic report can create bearish sentiment.
- Correlate sentiment changes with market price movements. Look for situations where sentiment and price trends align, as this can strengthen your trading thesis.
Risk Management
- Implement strict risk management rules, including stop-loss orders and position sizing. Sentiment-driven price movements can be volatile, so protect your capital.
- Be prepared for unexpected sentiment shifts and have contingency plans in place.
Time Frame Consideration
- Day trading involves short-term trades, so focus on short-term sentiment factors that can impact your trading decisions. Longer-term sentiment trends may not be as relevant.
Backtesting and Learning
- Backtest your trading strategies based on sentiment data to evaluate their historical performance.
- Continuously learn from your trades and adjust your approach based on the effectiveness of sentiment analysis in your day trading strategy.
Psychological Discipline
- Emotions can run high in day trading, especially when following sentiment-driven strategies. Maintain emotional discipline and avoid impulsive decisions.
- Stick to your trading plan and risk management rules, regardless of the prevailing sentiment.
Diversification
Diversify your trades to reduce risk. Relying solely on sentiment analysis can lead to over-concentration in specific assets or sectors.
Remember that sentiment analysis is just one tool in your trading toolkit. It should be used in conjunction with technical analysis, fundamental analysis, and other indicators to form a well-rounded trading strategy. Additionally, day trading can be highly speculative and involves significant risks, so it's essential to have a solid understanding of the markets and a well-thought-out trading plan before engaging in day trading activities.
Conclusion
Market sentiment is the pulse of the trading arena, driven by emotions and perceptions that shape asset prices. It swings between optimism and pessimism, with bullish sentiment radiating confidence and driving prices higher, while bearish sentiment instills fear and leads to selling.
Market sentiment is influenced by economic data, geopolitical events, corporate news, earnings reports, and social media. Contrarian traders challenge prevailing sentiment, buying in fear and selling in greed, expecting mean reversion.
Analysts use surveys, options data, and sentiment indexes as barometers of sentiment. Herd behavior, where investors follow the crowd, can amplify market movements.
Market sentiment has short-term effects, sparking dramatic price swings, while long-term fundamentals, like earnings, play a larger role.
Fear and greed are the twin emotions underpinning sentiment. Fear can trigger panic, while greed drives risk-taking and bubbles.
Using sentiment in day trading involves real-time news and sentiment monitoring, analyzing sentiment indicators, employing contrarian strategies cautiously, correlating sentiment with news catalysts, and robust risk management. Emotional discipline is crucial, and diversification is key.
In day trading, sentiment is a valuable partner, offering insights, but it should be part of a comprehensive trading strategy.

About AdroFx
Established in 2018, AdroFx is known for its high technology and its ability to deliver high-quality brokerage services in more than 200 countries around the world. AdroFx makes every effort to keep its customers satisfied and to meet all the trading needs of any trader. With the five types of trading accounts, we have all it takes to fit any traders` needs and styles. The company provides access to 115+ trading instruments, including currencies, metals, stocks, and cryptocurrencies, which make it possible to make the most out of trading on the financial markets. Considering all the above, AdroFx is the perfect variant for anyone who doesn't settle for less than the best.
Related Articles

Latest updates
Latest updates


Technical Analysis
Latest updates


