Global Market Analysis: US Interest Rates Surge, FTSE 100 Declines, and Gold Faces Precarious Positio | Daily Market Analysis
Key events:
- USA - Initial Jobless Claims
- USA - Philadelphia Fed Manufacturing Index (Aug)
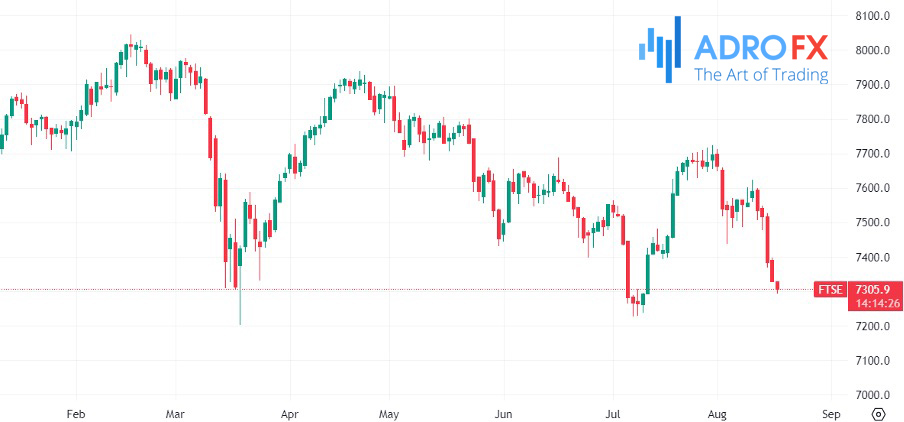
While European markets have experienced a lack of clear direction this week, displaying a slight downward trend, the FTSE 100 is poised to record its most significant weekly decline in over a month.
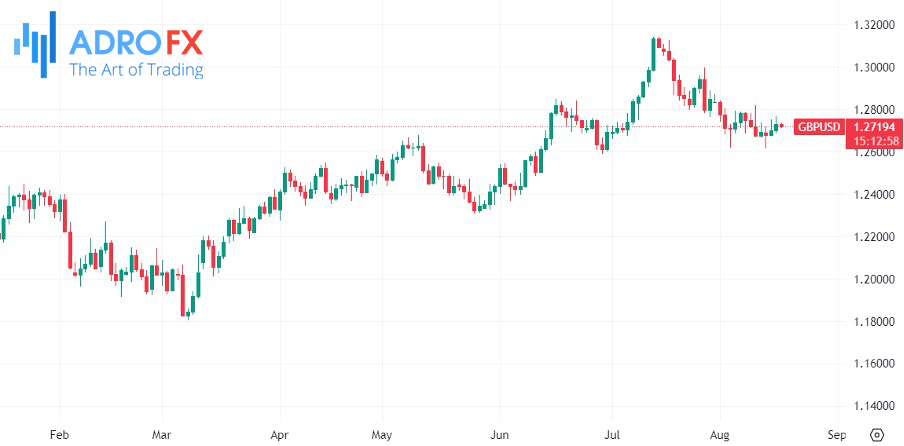
The UK's inflation data released yesterday morning has boosted the value of the pound. However, it has simultaneously placed UK-centric stocks in a less favorable position.
While the overall inflation figures may appear positive, the strong performance of core Consumer Price Index (CPI) suggests that the Bank of England (BoE) might need to exert more effort to combat inflation, potentially increasing the risk of a more substantial economic decline in the UK. As a consequence, the FTSE 100 has weakened, displaying poorer performance compared to other European indices. Yesterday's downturn has particularly affected sectors such as UK housebuilders and banks, contributing to the FTSE 100's underperformance.
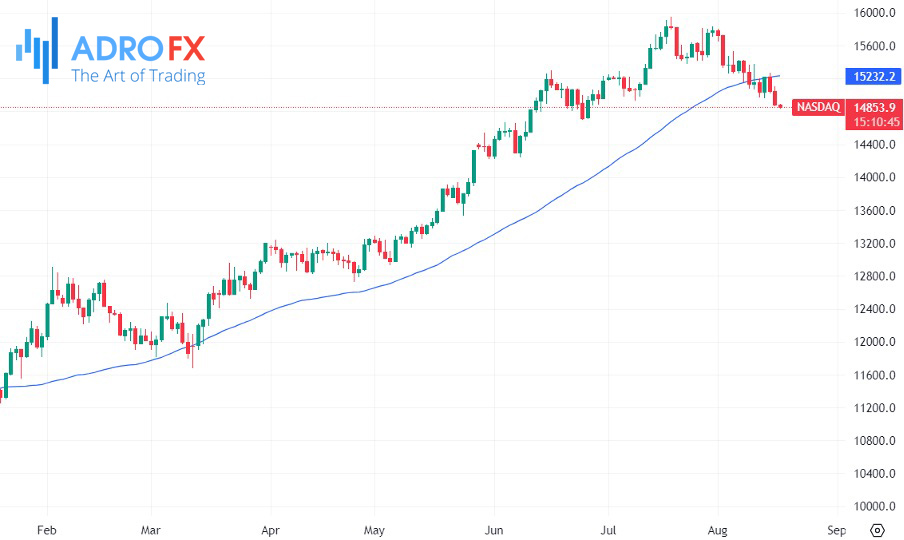
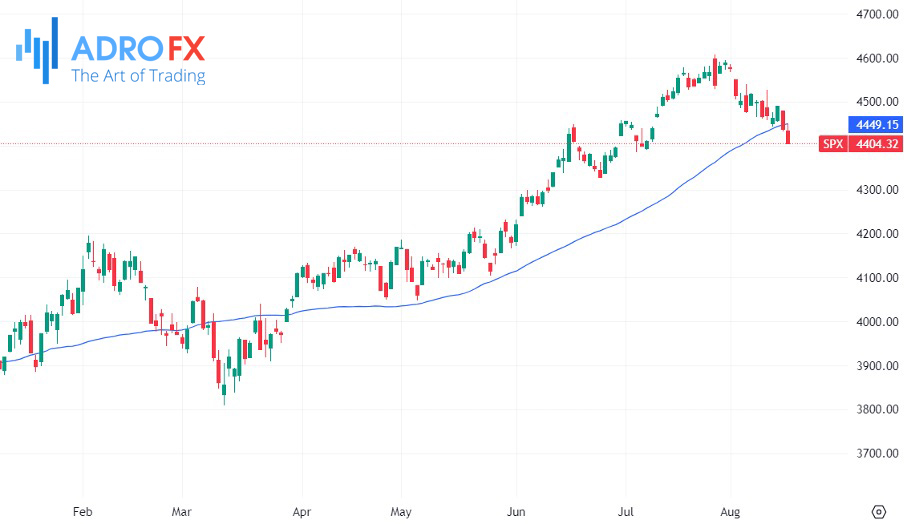
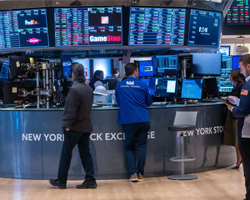
In the United States, markets faced additional strain following the release of the latest Federal Reserve minutes, causing a decline to one-month lows. The Nasdaq 100 took the lead in this downward movement, as both the S&P 500 and Nasdaq extended their distance from their 50-day SMA levels.
The decline after the release of the minutes, coupled with the potential for prolonged higher interest rates, is likely to result in another weak start for European markets. Concurrently, Asian markets are also grappling with pressure amid concerns about the Chinese economy's future prospects.
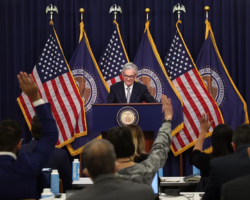
The minutes from the Federal Reserve's July meeting, released on Wednesday, indicated that a majority of the rate-setting committee members favored raising interest rates as a measure to combat persistent inflation.
While there were differing opinions among officials regarding the necessity of further rate hikes, the prevailing sentiment was that inflation could still present upward risks. This scenario might lead to additional rate increases by the central bank over time. Additionally, July's US inflation figures indicated an increase.
Following the release of the minutes, the US dollar surged to a nearly two-month high, and the benchmark 10-year Treasury yields reached their highest point in almost 10 months. The yields were also on the verge of approaching levels last observed during the 2008 financial crisis.
The potential for heightened US interest rates spells trouble for gold, as it enhances the opportunity cost of investing in non-yield-bearing assets. This concept had exerted downward pressure on the precious metal throughout 2022 and is anticipated to continue weighing on gold until the Federal Reserve initiates a rate reduction.
Analysts anticipate that the Federal Reserve will maintain elevated interest rates for the next six months, with Goldman Sachs projecting a rate cut only by mid-2024.
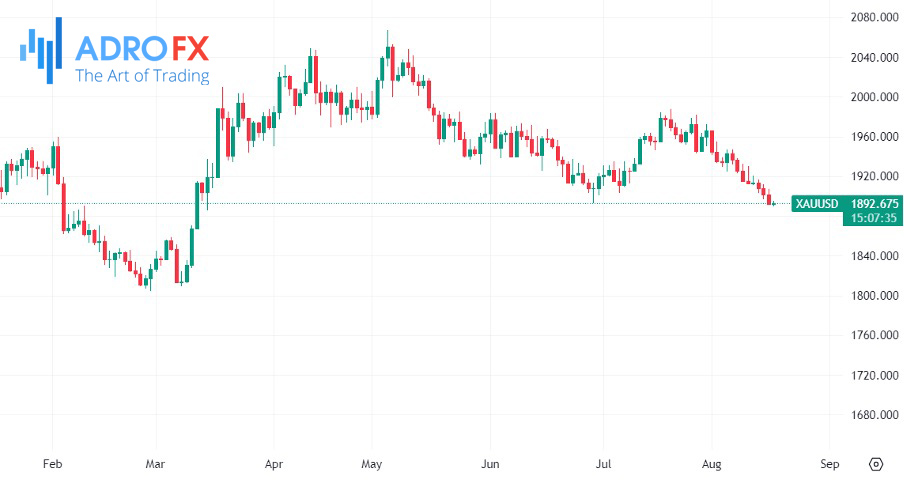
During this week, spot gold experienced a drop below the critical level of $1,900 per ounce, reaching its lowest point in five months. This decline was attributed to the influence of both a strengthening US dollar and rising Treasury yields.
Despite growing concerns about a potential economic slowdown in China, gold failed to witness a substantial increase in safe-haven demand. Traders predominantly favored the dollar due to the prospect of higher yields.
The dollar's strength drove the yen further into intervention territory on Thursday, as the robust US economy highlighted the necessity for sustained higher interest rates. This contrasts with the persistently dovish stance of the Bank of Japan.
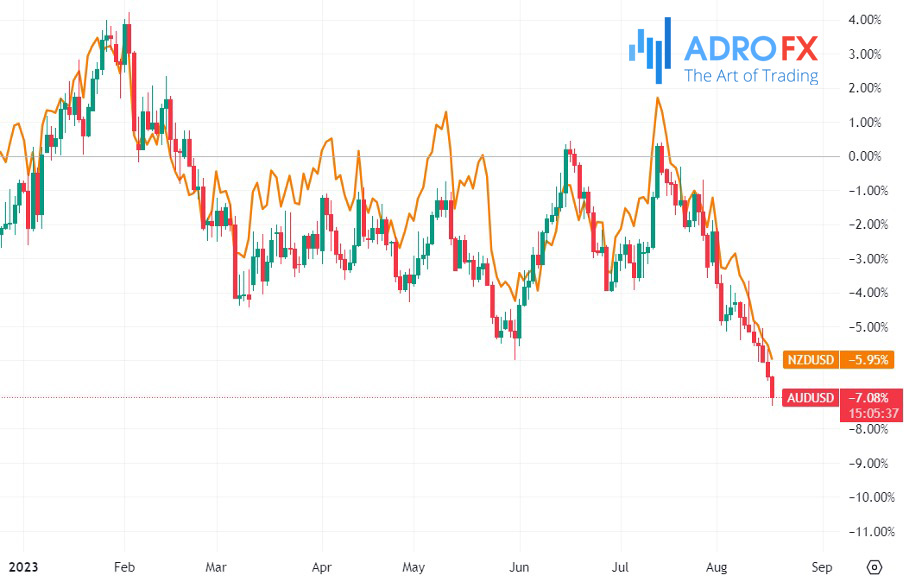
The Australian dollar dipped to a nine-month low, pulling its New Zealand counterpart down with it. This decline followed data indicating an unexpected drop in Australia's employment figures for July, coupled with a slight increase in the unemployment rate.
The yen weakened to 146.565 against the dollar, marking its lowest point since November. This weakening resulted from the disparities in interest rates between the US and Japan's ultra-low rate environment. The currency was last traded at 146.37 per dollar.
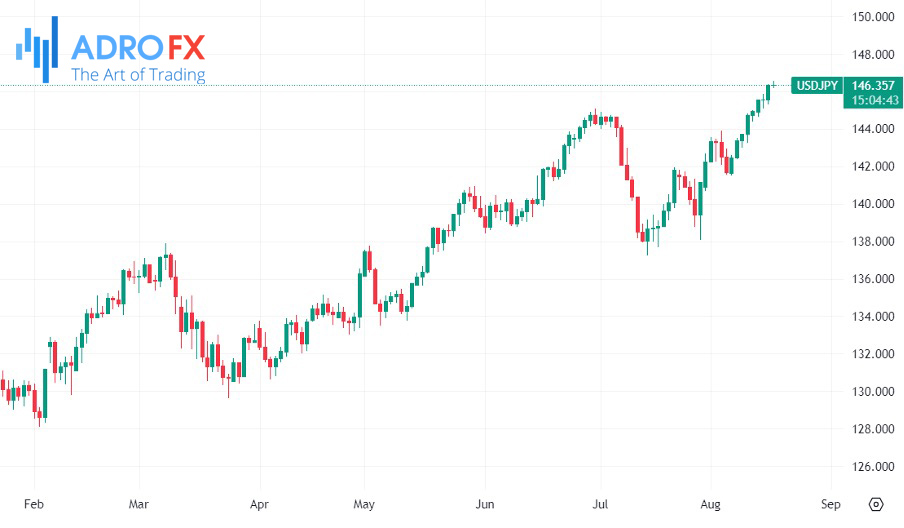
The Japanese yen has garnered close attention since it breached the crucial 145 per dollar threshold, a level last observed about nine months ago. This entry into this zone prompted Japanese authorities to intervene in the foreign exchange market in both September and October of the previous year.
Related Articles

Latest updates
Latest updates


Technical Analysis
Latest updates


