A Comprehensive Guide to OHLC Charts
OHLC, an acronym for Open, High, Low, Close, may sound like cryptic jargon to the uninitiated, but for traders, it's a fundamental concept that holds the key to deciphering market dynamics. In this article, we will demystify OHLC charts and explore their significance in trading. We will also delve into the challenges posed by forex and extended-hours trading, shed light on interpreting OHLC data, and discuss trading strategies tailored for these charts. By the end, you'll have a comprehensive understanding of OHLC and how to leverage it to your advantage in the world of trading.
What Does OHLC Mean?
OHLC stands for Open, High, Low, Close. These terms are quite self-explanatory and may already be familiar to you.
- Open refers to the initial price at which an asset begins its trading day. For instance, if you're trading Apple stock, the open price signifies where its price started at the beginning of the trading day. This price is determined by the supply and demand for the asset when the day commences.
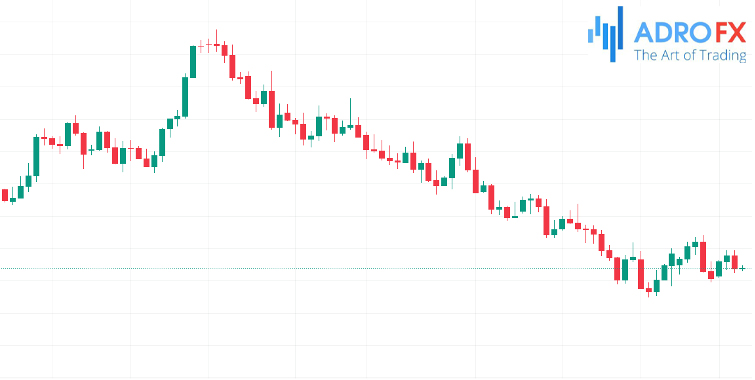
Example of OHLC (candlestick) - High represents the highest price level the asset reached during the trading day. For instance, if Apple started the day at $100, reached a peak of $120, and then began to decline, the high for that day would be $120.
- Low denotes the lowest price point reached during the day's trading. Lastly, Close indicates the final price at which the asset is traded for the day. Popular types of OHLC charts include Japanese candlesticks and bar charts.
What Doesn't Qualify as Open High Low Close?
A line chart does not qualify as an OHLC chart because it solely displays the closing price of an asset. Similarly, point and figure charts, Kagi charts, and renko charts do not fall under the OHLC category, as they typically filter out the time-based noise.
Challenges with Forex and US OHLC Data
While these concepts may seem straightforward, there are some complexities to consider. In the forex market, there are two key opening and closing prices: the open price when the market begins on Monday and the close price when it shuts for the weekend on Friday. The challenge arises because the forex market operates 24 hours a day, making it challenging to pinpoint the exact open and close prices.
A similar issue arises when examining shares of US-listed companies due to extended-hours trading. Extended hours encompass pre-market and after-market trading, which occurs after the market closes and before it reopens.
Significance of OHLC Charts for Traders
For traders, understanding OHLC prices is crucial because they provide insights into an asset's daily trading range. This range can help identify the level of volatility in the market.
For instance, if Apple's open price is $100, its high is $101, the low is $99.5, and the close is $100, it suggests minimal volatility in the stock. Conversely, if the open is $100, the high reaches $110, the low drops to $95, and the close settles at $115, it indicates a high degree of volatility in the company's stock.
Traders have varying preferences regarding trading during periods of low or high volatility.
These three price points are also significant when applying indicators to assets. Most indicators typically require you to specify which price you want to use. While most traders use closing prices, some opt for open prices.
How to Interpret and Apply OHLC Charts
Understanding and utilizing OHLC charts is straightforward, especially when using Japanese candlesticks, which are the most prevalent charting method.
Japanese candlesticks effectively encapsulate OHLC data within their structure, making them a user-friendly choice.
To access OHLC data on platforms like MT4, you can easily enable it by navigating to the chart properties and selecting "Show Open-High-Low-Close." This will display these crucial price points at the top of the chart. Alternatively, you can find plugins or add-ons in the marketplace to provide this information.
Furthermore, you can also incorporate OHLC volume and histogram data into your analysis. These three tools collectively provide valuable insights into market movements, with OHLC data highlighted in pink on the chart.
OHLC Trading Strategies
There are various day trading strategies tailored for OHLC bar charts, broadly categorized into two main approaches: technical analysis and price action analysis.
Technical Analysis
This strategy leverages chart patterns and combines them with mathematical indicators to make informed trading decisions. Some popular technical indicators used for OHLC chart analysis include:
- Average True Range (ATR): Measures market volatility.
- Average Directional Movement Index (ADX): Identifies the strength of a trend.
- Relative Strength Index (RSI): Gauges overbought or oversold conditions.
Price Action Analysis
This approach involves scrutinizing chart patterns to identify unique formations that can guide trading decisions. Common price patterns include:
- Bullish and Bearish Flags: Patterns indicating temporary consolidation before a potential breakout.
- Bullish and Bearish Pennants: Similar to flags, these patterns suggest a pause before a potential price move.
- Triangle Patterns: Ascending, descending, or symmetrical triangles signaling potential breakouts or breakdowns.
By incorporating these strategies and tools, traders can make well-informed decisions when navigating OHLC charts, enhancing their ability to capitalize on market opportunities.
Conclusion
OHLC charts are not just four data points on a graph; they are windows into the complex world of financial markets. As we've seen, they provide vital insights into an asset's daily trading range and market volatility, making them indispensable tools for traders. Whether you're a technical analyst or prefer a price action approach, OHLC charts offer a wealth of information to inform your trading decisions. By mastering the art of interpreting and applying OHLC data, you can enhance your ability to navigate the financial markets and seize opportunities when they arise. So, remember these four letters - O, H, L, C - and let them guide you on your trading journey.
About AdroFx
Established in 2018, AdroFx is known for its high technology and its ability to deliver high-quality brokerage services in more than 200 countries around the world. AdroFx makes every effort to keep its customers satisfied and to meet all the trading needs of any trader. With the five types of trading accounts, we have all it takes to fit any traders` needs and styles. The company provides access to 115+ trading instruments, including currencies, metals, stocks, and cryptocurrencies, which make it possible to make the most out of trading on the financial markets. Considering all the above, AdroFx is the perfect variant for anyone who doesn't settle for less than the best.
Related Articles

Latest updates
Latest updates


Technical Analysis
Latest updates


