Unlocking the Candlestick Secrets: Actionable Insights to Elevate Your Analysis
In the realm of financial markets, mastering the art of candlestick analysis has long been regarded as a crucial skill for traders and investors alike. Originating from ancient Japan, the candlestick charting technique has withstood the test of time, providing valuable insights into market sentiment, price trends, and potential reversals. As the markets continue to evolve and become increasingly complex, honing one's candlestick analysis proficiency becomes more pertinent than ever.
In this illuminating article, we delve deep into the world of candlestick analysis, unraveling five actionable insights that are poised to revolutionize the way you interpret price movements and make more informed trading decisions. Whether you are a novice trader seeking to enhance your technical prowess or a seasoned investor in search of fresh perspectives, these invaluable tips are tailored to cater to every level of expertise.
From decoding candlestick patterns and understanding their underlying psychology to employing advanced strategies that transcend traditional interpretations, we leave no stone unturned in our pursuit of empowering you with the knowledge required to navigate the volatile waters of financial markets confidently. As the saying goes, a candle loses nothing by lighting another candle, and so, we aim to pass on our candlestick wisdom so that you may light up your own path to success.
So, join us as we embark on this enlightening journey, demystifying the secrets hidden within the flickering candlesticks and equipping you with the tools to sharpen your analytical acumen. Prepare to witness a transformation in your trading approach, as we unveil the five actionable insights that will undoubtedly pave the way to a brighter, more prosperous future in the ever-exciting world of finance.
What Are Candlesticks?
Candlesticks, also known as Japanese candlestick charts, are a popular and powerful technical analysis tool used to visualize the price movements of financial assets, such as stocks, currencies, commodities, and cryptocurrencies. Originating in Japan in the 18th century, this visual representation of price data has since become a fundamental aspect of modern trading and investing.
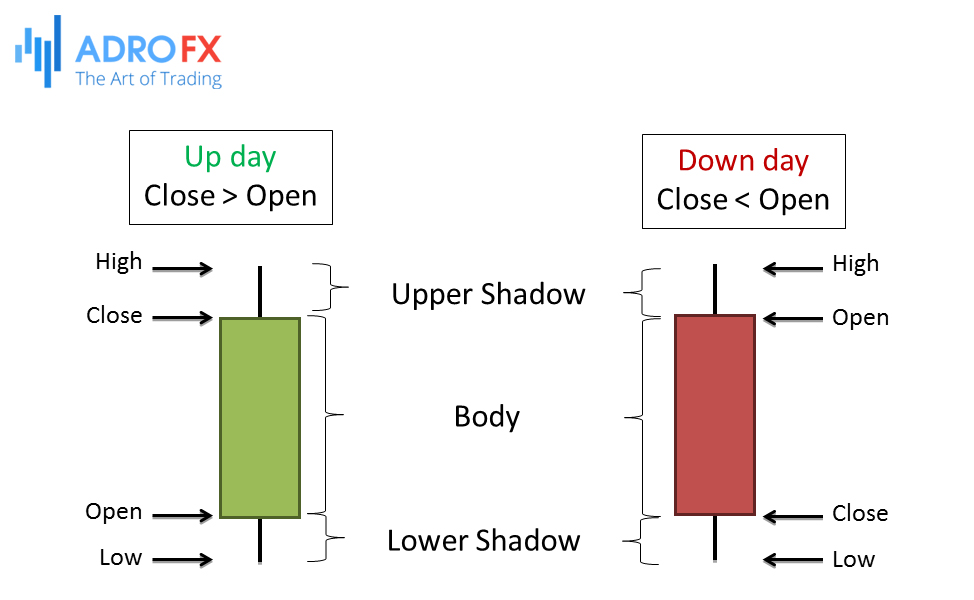
Unlike traditional bar charts, candlestick charts offer a more comprehensive and intuitive view of market sentiment and price action. Each candlestick typically represents a specific time frame, such as a day or an hour, and consists of a rectangular body and thin lines called "wicks" or "shadows" at either end.
The body of the candlestick represents the price range between the opening and closing prices for the given time period. If the closing price is higher than the opening price, the body is usually filled or colored, commonly green or white, indicating bullish or positive sentiment. Conversely, if the closing price is lower than the opening price, the body is typically empty or colored red or black, signaling a bearish or negative sentiment.
The wicks above and below the body, also called "upper shadow" and "lower shadow," represent the price range between the high and low of the time frame. These wicks provide essential information about price volatility and the intraday trading range:
Candlestick patterns, which emerge from the combination of several consecutive candles, offer valuable insights into potential trend reversals, continuation patterns, and psychological shifts in the market. Understanding and interpreting these patterns can significantly enhance a trader's ability to make well-informed decisions and capitalize on market opportunities.
In the following sections of this article, we will delve deeper into the intricacies of candlestick analysis, exploring how these visual representations hold the key to deciphering market behavior and empowering traders to navigate the financial markets with confidence and precision.
What Are Candlestick Patterns?
Candlestick patterns are specific formations that emerge from the arrangement of multiple candlesticks on a price chart. These patterns are essential tools for technical analysts as they offer insights into the potential direction of price movements, trend reversals, and the psychology of market participants. Candlestick patterns are categorized into two main groups: continuation patterns and reversal patterns.
Continuation Patterns
Continuation patterns suggest that the prevailing trend is likely to continue after a temporary pause or consolidation. These patterns signal a period of indecision among traders before the market resumes its previous trajectory.
Some common continuation patterns include:
- Bullish and Bearish Flags: These are small rectangles that form after a sharp price movement, indicating a brief consolidation before the trend resumes.
- Pennants: Similar to flags, pennants are characterized by converging trend lines, reflecting temporary indecision.
- Triangles: These patterns form when prices converge into a series of higher lows and lower highs, signaling a continuation of the prevailing trend.
- Cup and Handle: This pattern involves a "U-shaped" cup followed by a smaller "handle," indicating a potential bullish continuation.
Reversal Patterns
Reversal patterns indicate a potential change in the prevailing trend, offering traders an early warning sign of a possible trend reversal.
Some common reversal patterns include:
- Head and Shoulders: A pattern that resembles a head between two shoulders, indicating a shift from an uptrend to a downtrend.
- Double Tops and Double Bottoms: These patterns signify potential trend reversals after failed attempts to break resistance levels (double tops) or support levels (double bottoms).
- Hammer and Hanging Man: These single candlestick patterns occur at the end of a downtrend and suggest a potential bullish reversal (hammer) or bearish reversal (hanging man).
- Engulfing Patterns: Consisting of two candlesticks, these patterns involve one candle entirely engulfing the previous one, signaling a shift in market sentiment.
Technical analysts use chart patterns in conjunction with other technical indicators to confirm signals and make well-informed trading decisions. The reliability of chart patterns can vary, and it's essential to consider the broader market context, volume, and price action before making trading choices based solely on these patterns.
It's essential to note that while candlestick patterns provide valuable insights, they are not foolproof indicators and should be used in conjunction with other technical tools and analyses. Moreover, the reliability of these patterns depends on the context in which they appear, such as the prevailing market conditions, volume, and overall price action.
Traders and investors who can effectively identify and interpret candlestick patterns can gain a deeper understanding of market dynamics and make more informed decisions to capitalize on potential trading opportunities.
How to Improve Your Candlestick Analysis
Candlestick analysis is a powerful tool in the arsenal of traders and investors, providing valuable insights into market sentiment and price movements. To elevate your candlestick analysis proficiency and make more informed trading decisions, consider the following actionable tips:
- Master the Basics
Start by understanding the foundational elements of candlestick analysis, including candlestick construction, terminology, and how to interpret different patterns. Familiarize yourself with bullish and bearish signals, wicks, and the significance of various candlestick shapes.
- Combine with Other Indicators
Enhance your candlestick analysis by incorporating other technical indicators such as moving averages, RSI (Relative Strength Index), MACD (Moving Average Convergence Divergence), or Bollinger Bands. Using multiple indicators can provide more comprehensive market insights and confirm the signals generated by candlestick patterns.
- Identify Key Candlestick Patterns
Focus on learning and recognizing the most reliable candlestick patterns, both continuation and reversal. Patterns like engulfing, doji, hammer, and evening star can offer valuable clues about market reversals and trend continuations.
- Context is Key
Consider the broader market context and time frames when analyzing candlestick patterns. A pattern that appears significant on a daily chart might be less relevant on an hourly chart. Understand the significance of patterns in different market conditions.
- Backtest and Practice
Test your candlestick analysis skills by backtesting historical data and comparing your predictions with actual price movements. This practice will help you refine your understanding of patterns and improve your ability to apply them in real-time trading scenarios.
- Risk Management
While candlestick analysis can provide valuable insights, it is essential to incorporate risk management strategies in your trading plan. Set stop-loss levels and adhere to them to protect your capital from substantial losses.
- Observe Volume
Pay attention to trading volume when analyzing candlestick patterns. High volume during a pattern confirmation can strengthen its significance, while low volume might indicate weaker confirmation.
- Stay Informed
Keep yourself updated with financial news, economic events, and market developments that can impact the assets you are trading. Fundamental analysis can complement your candlestick analysis and provide a well-rounded perspective.
- Maintain a Trading Journal
Record your observations, trades, and outcomes in a trading journal. Reviewing your past trades will help you identify patterns of success and areas for improvement in your candlestick analysis approach.
- Practice Patience
Finally, be patient and avoid acting solely on impulse. Successful candlestick analysis requires discipline, time, and practice. Wait for strong confirmation before making trading decisions.
By continuously honing your candlestick analysis skills and integrating them with other analytical tools, you can unlock valuable insights into market behavior and gain a competitive edge in your trading endeavors. Remember that proficiency in candlestick analysis is a journey, and with dedication and practice, you can become a more confident and successful trader.
Conclusion
In conclusion, mastering the art of candlestick analysis can significantly elevate one's trading prowess and decision-making abilities in the dynamic world of financial markets. With origins tracing back to ancient Japan, candlestick charts have stood the test of time and continue to be a fundamental aspect of modern technical analysis.
Whether you are a novice trader seeking to improve your technical acumen or a seasoned investor searching for fresh perspectives, the journey of unlocking the candlestick secrets is one of continuous learning and growth. Embrace the knowledge gained from this article and embark on your trading endeavors with confidence, as the five actionable insights pave the way to a brighter and more prosperous future in the ever-exciting world of finance.

About AdroFx
Established in 2018, AdroFx is known for its high technology and its ability to deliver high-quality brokerage services in more than 200 countries around the world. AdroFx makes every effort to keep its customers satisfied and to meet all the trading needs of any trader. With the five types of trading accounts, we have all it takes to fit any traders` needs and styles. The company provides access to 115+ trading instruments, including currencies, metals, stocks, and cryptocurrencies, which make it possible to make the most out of trading on the financial markets. Considering all the above, AdroFx is the perfect variant for anyone who doesn't settle for less than the best.
Related Articles

Latest updates
Latest updates


Technical Analysis
Latest updates


