Tech Stocks Lead Market Rally as Nvidia Soars, GBP and Gold Struggle Amid Dollar Strength | Daily Market Analysis

Key events:
- USA - Crude Oil Inventories
- USA - 10-Year Note Auction
- USA - FOMC Meeting Minutes
The stock market closed on a strong note, with tech stocks driving gains, notably led by Nvidia, as the third-quarter earnings season got underway.
The Dow Jones Industrial Average climbed 126 points, or 0.3%, while the S&P 500 saw a rise of 1%, and the NASDAQ Composite surged by 1.4%.
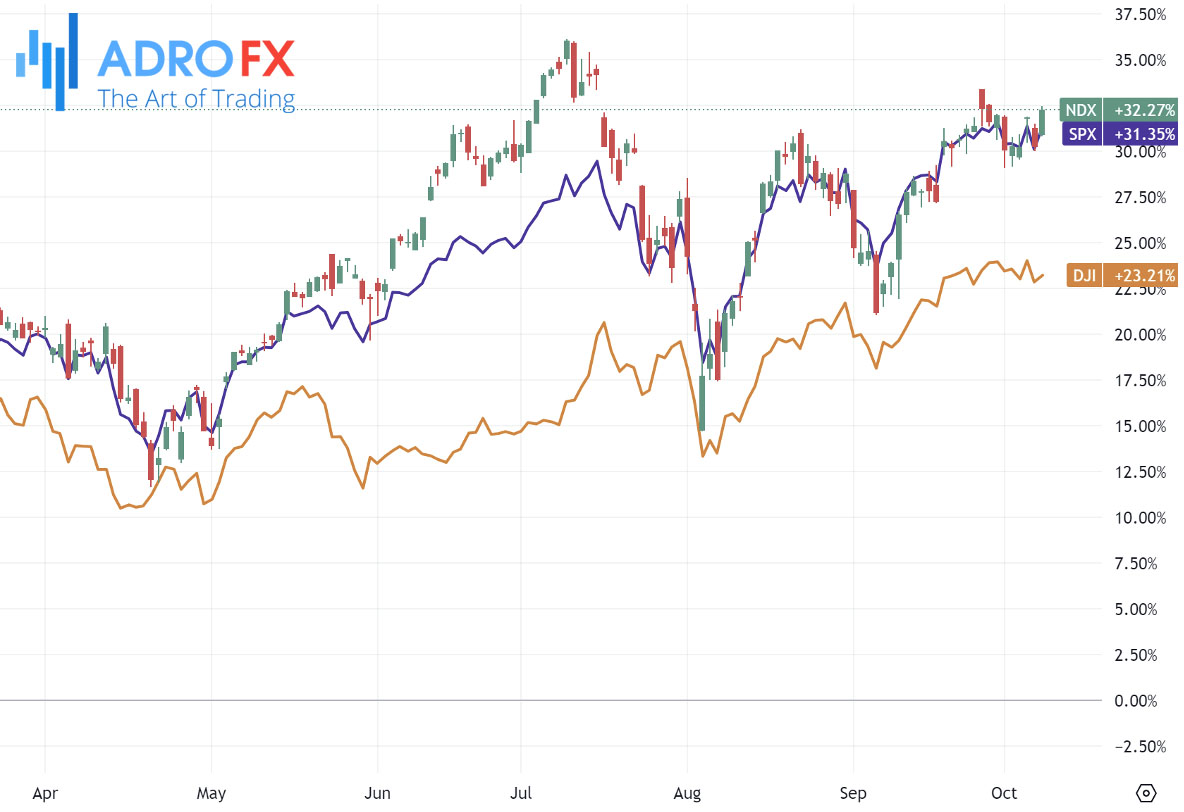
Nvidia (NASDAQ: NVDA) was the main force behind this rally, benefiting from increased optimism in chip demand. Foxconn Chairman Young Liu commented that demand for Foxconn servers, powered by Nvidia’s highly anticipated Blackwell chip, exceeded initial expectations, further bolstering Nvidia's stock performance.
Alphabet (NASDAQ: GOOG) also experienced slight gains following a US court ruling that dealt a blow to Google’s defense in its ongoing antitrust case. A judge ordered Google to alter its Android operating system to allow competitors to develop and offer alternative app stores and payment systems, signaling a significant shift in its market control. Although the stock rose, the ruling marks a potential turning point in the company's antitrust challenges.
In the currency markets, the British pound struggled to extend its recovery. The GBP/USD pair remained under pressure during Wednesday’s Asian trading session, hovering around 1.3080, near a four-week low reached earlier in the week. The pound has been lagging in performance, largely due to expectations that the Bank of England might speed up its rate-cutting cycle. BoE Governor Andrew Bailey recently suggested that the central bank could adopt a more aggressive stance on cutting rates if inflation continues to decline. This dovish outlook has contributed to the pound’s weakness against the US dollar.
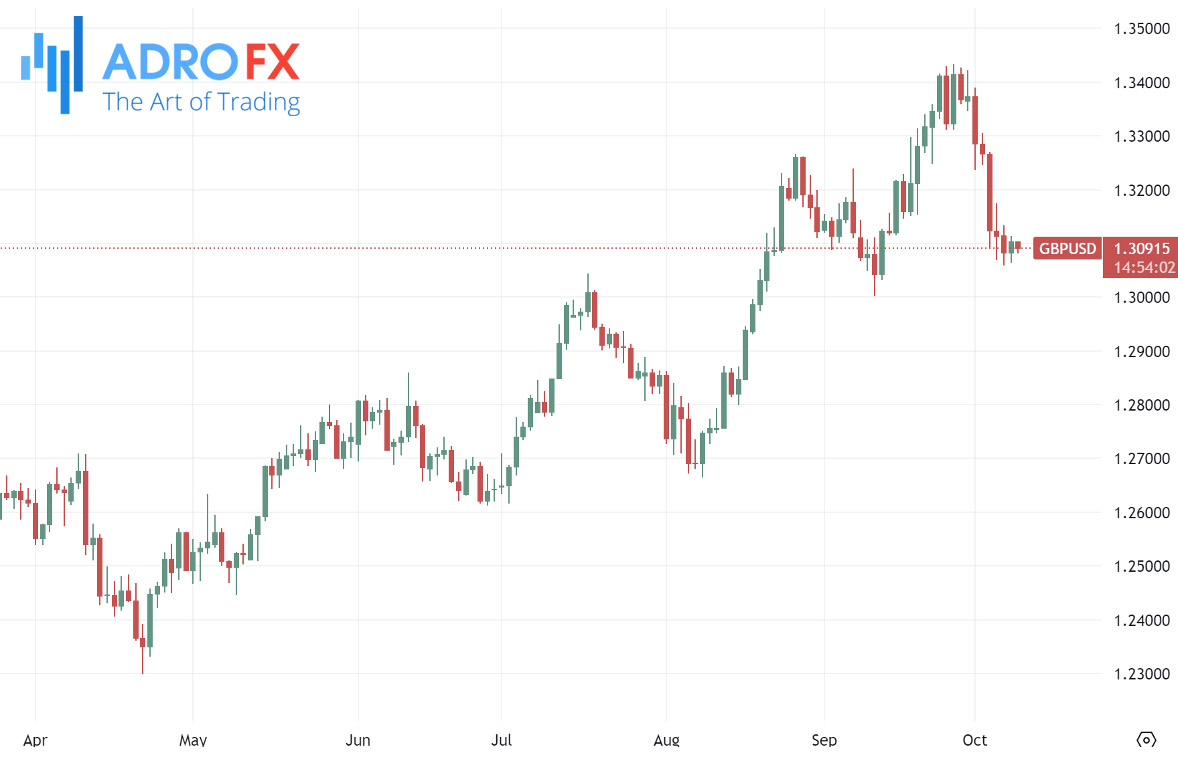
Conversely, the US dollar has maintained its strength, trading near a seven-week high as market participants downplay the likelihood of aggressive policy easing by the Federal Reserve. There is currently an 85% chance that the Fed will cut interest rates by 25 basis points in November, according to market expectations. In addition to the Fed's policy outlook, geopolitical uncertainties in the Middle East and disappointment over China's recent stimulus measures have added to the dollar’s strength, putting further downward pressure on the GBP/USD.
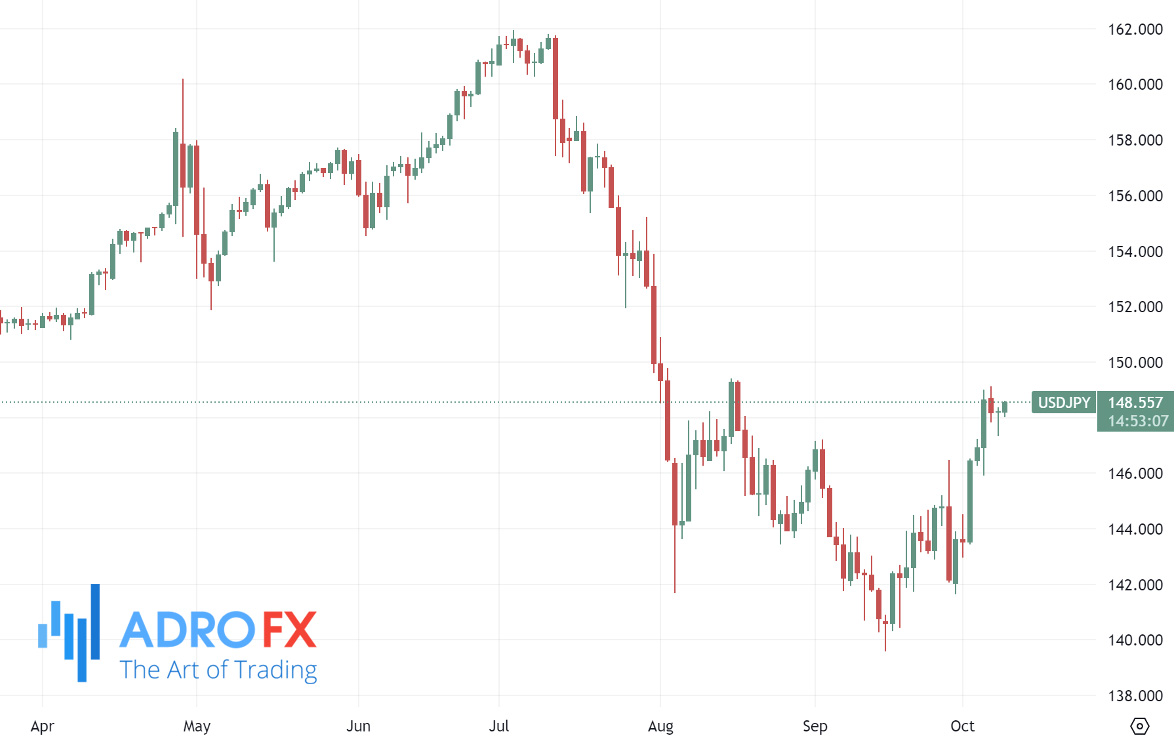
The Japanese yen has also remained weak, with the USD/JPY pair approaching a weekly high as traders await the release of the Federal Open Market Committee meeting minutes. The yen has struggled against the US dollar due to reduced expectations for further rate hikes by the Bank of Japan. Recent data showing a decline in Japan's real wages in August after two consecutive months of growth has kept yen bulls on the defensive.
The Australian dollar extended its losses, with the AUD/USD pair trading near 0.6740 during the Asian session. The stronger US dollar, combined with disappointment over China’s limited stimulus measures, has weighed heavily on the pair. According to the Reserve Bank of Australia September Meeting Minutes, board members discussed potential future rate adjustments, both upward and downward, as they continue to battle persistent inflation. RBA Deputy Governor Andrew Hauser emphasized that the central bank is not yet finished with its efforts to bring inflation under control.
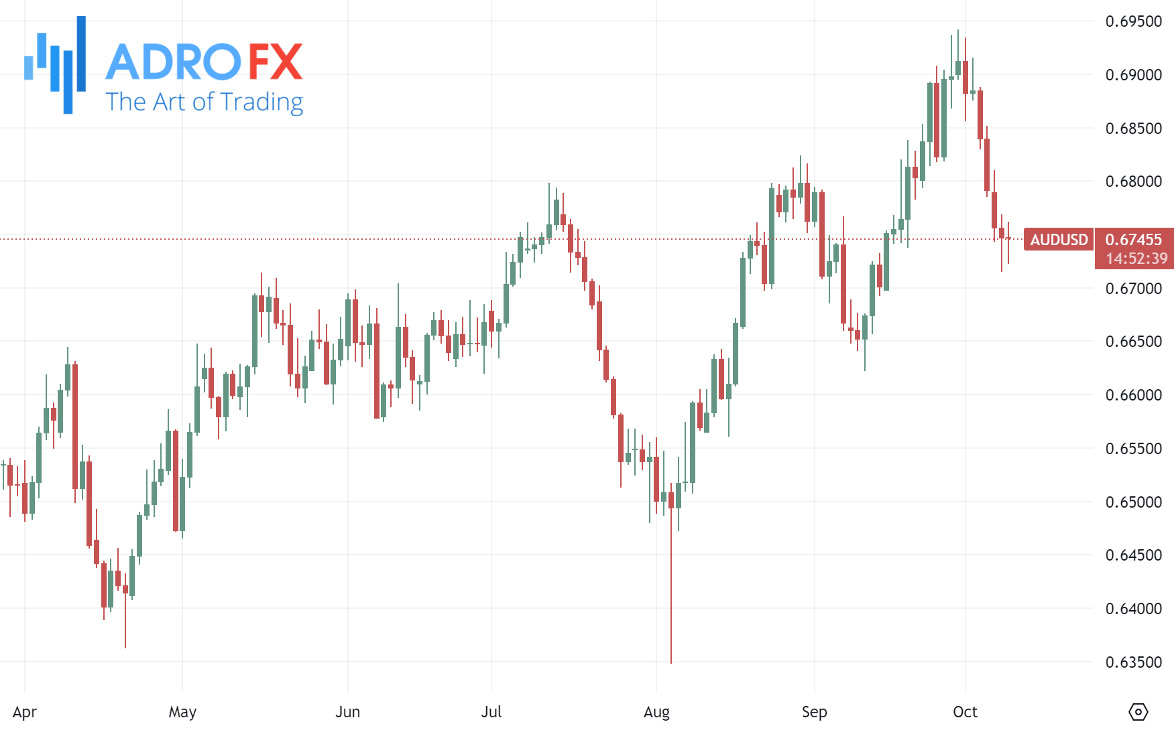
China's economic policies have also exerted selling pressure on the Australian dollar. At a recent press conference, officials from the National Development and Reform Commission failed to announce significant new stimulus measures, which left traders disappointed and contributed to the weakness of the AUD, given Australia’s close economic ties with China.
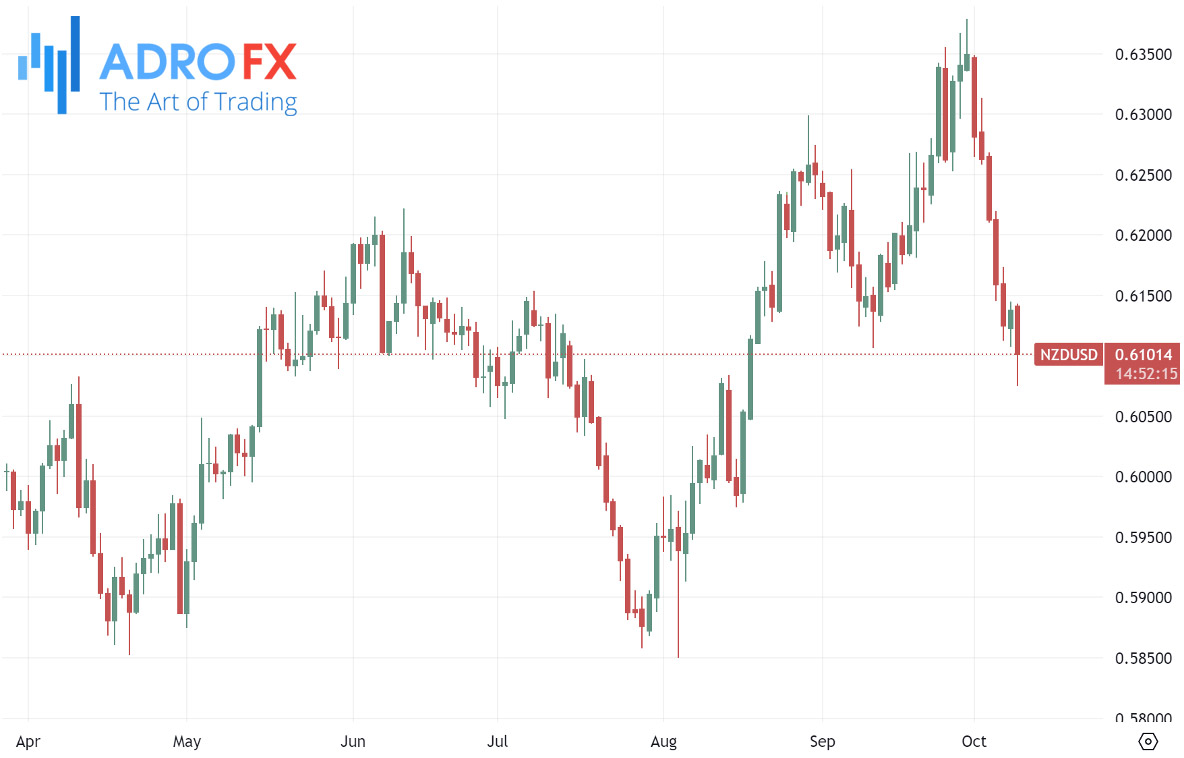
Likewise, the New Zealand dollar struggled, hitting its lowest point since mid-August. The Reserve Bank of New Zealand cut its Official Cash Rate (OCR) by 50 basis points, reducing it from 5.25% to 4.75%, in line with market expectations. However, the decision triggered selling pressure, causing the NZD to drop. Additionally, New Zealand's close trade relationship with China, coupled with China’s lack of meaningful stimulus measures, has further dragged the NZD lower against the US dollar.
Gold has also been under selling pressure for six straight days, although it managed to hold above a three-week low reached in the prior session. Investors have adopted a cautious approach ahead of key data releases, including the FOMC meeting minutes and upcoming US inflation figures. These reports are expected to provide further insights into the Federal Reserve’s interest rate trajectory and could have a significant impact on the US dollar’s price movement, influencing gold’s near-term direction.
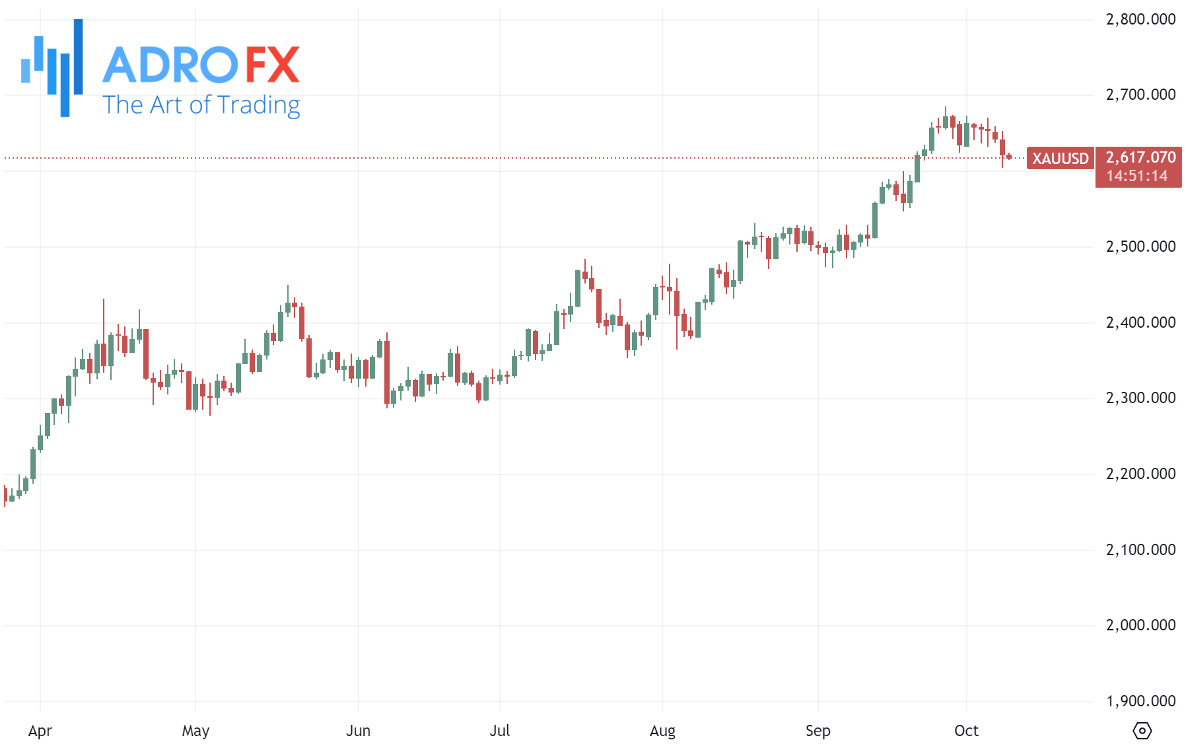
The recent dip in gold prices can also be attributed to technical factors, as the price broke below key support levels. The breach of the $2,630 support line marked the lower end of a short-term trading range, triggering technical selling that further contributed to gold’s decline. Traders will be closely watching the developments from the Fed and other macroeconomic indicators to determine the next move in the market.
Overall, tech stocks led by Nvidia drove significant market gains, while the US dollar continued to strengthen, weighing on major currencies like the British pound, Japanese yen, Australian dollar, and New Zealand dollar. Gold remains under pressure, with traders awaiting key economic data for further direction.
Related Articles


Latest updates
Latest updates


Technical Analysis
Latest updates


