RSI Trading Strategies: Enhance Your Day Trading with the Relative Strength Index
In the fast-paced world of day trading, having powerful tools at your disposal is essential for making timely, profitable decisions. The Relative Strength Index (RSI) stands out for its ability to measure market momentum and identify trading opportunities. As a highly adaptable and widely respected momentum oscillator, the RSI helps traders detect overbought and oversold conditions and spot potential trend reversals. Whether you’re new to trading or a seasoned expert, mastering the RSI can significantly refine your trading strategy and improve your trading outcomes.
Understanding the Relative Strength Index (RSI) Indicator
The Relative Strength Index (RSI) is a popular momentum oscillator developed by J. Welles Wilder in 1978. It measures the strength and speed of price movements to identify potential overbought and oversold conditions, as well as possible trend reversals.
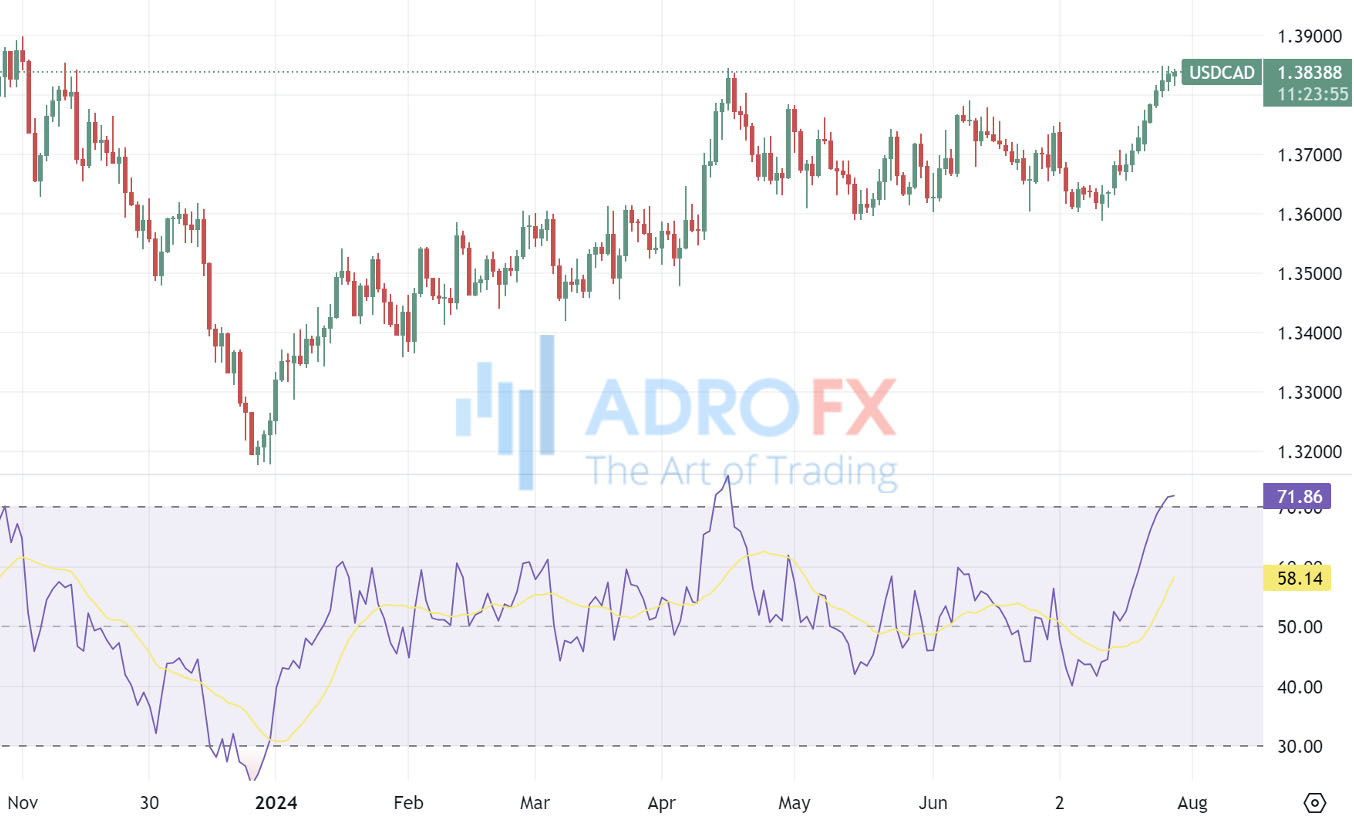
The RSI is calculated based on the average gains and losses over a specified period, typically 14 periods. It provides a value between 0 and 100, reflecting the ratio of upward to downward price movements. An RSI above 70 usually indicates that an asset might be overbought, suggesting that its price has increased too quickly and may be due for a correction. Conversely, an RSI below 30 suggests that an asset might be oversold, indicating that its price has dropped significantly and may be poised for a rebound.
Traders often use the RSI alongside other technical indicators and chart patterns to make more informed decisions. For example, if the RSI indicates an overbought condition and is supported by bearish price action or divergence with other indicators, it might signal a potential sell opportunity. Similarly, if the RSI shows an oversold condition and aligns with bullish price action or divergence, it could suggest a potential buy opportunity.
Despite its advantages, the RSI has limitations and can sometimes produce false signals. Therefore, it should be used as part of a comprehensive trading strategy. Traders should also consider other factors such as market trends, support and resistance levels, and fundamental analysis when making trading decisions. Effective risk management is essential to mitigate potential losses and avoid relying solely on the RSI for trading choices.
Exploring the Multifaceted Uses of the RSI
The Relative Strength Index (RSI) is a versatile tool in the trader’s toolkit, offering a range of insights into market dynamics. Here’s how the RSI can enhance your trading strategy:
Uncovering Market Momentum
At its core, the RSI helps measure the strength and direction of price movements. By comparing recent gains to recent losses over a specified period, it delivers a numerical value reflecting whether an asset is experiencing strong upward or downward momentum. This allows traders to gauge the market’s energy and potential direction.
Detecting Overbought and Oversold Conditions
A popular application of the RSI is spotting overbought or oversold conditions. An RSI value approaching or surpassing 70 typically indicates that an asset might be overbought, suggesting a potential price correction. Conversely, an RSI dropping near or below 30 signals that an asset may be oversold, hinting at a possible price rebound.
Pinpointing Trend Reversals
The RSI is also useful for spotting potential trend reversals. When the RSI diverges from the price trend (for example, the RSI hits higher highs while the price reaches lower highs, or vice versa), it may signal that the current trend is losing steam and a reversal could be on the horizon.
Validating Price Movements
Traders frequently pair the RSI with other technical indicators or chart patterns for confirmation. If the RSI indicates overbought conditions while other signals suggest a downturn, it can reinforce the decision to take a short position. This cross-validation helps strengthen trading signals and decisions.
Analyzing Divergences
RSI divergences offer crucial insights into potential market shifts. Bullish divergences, where the RSI shows higher lows while the price makes lower lows, may suggest waning selling pressure and a possible upward move. On the flip side, bearish divergences, with lower highs on the RSI while the price makes higher highs, might point to weakening buying pressure and a potential decline.
Measuring Volatility
The RSI can also reflect market volatility. Significant price swings typically cause dramatic changes in RSI values, while a steady market with minimal fluctuations results in more stable RSI readings. This helps traders assess market calmness or turbulence.
Combining with Other Tools
While the RSI is a powerful tool, it is most effective when used alongside other technical indicators, chart patterns, and fundamental analysis. Integrating these elements provides a fuller picture of the market and aids in crafting more informed trading strategies. Always remember to incorporate risk management practices to safeguard your investments.
Harness the full potential of the RSI by incorporating it into a comprehensive trading approach, and watch as it enhances your market analysis and decision-making prowess.
Also read: Best Forex Trading Indicators Every Trader Should Use
Optimal Settings for the RSI
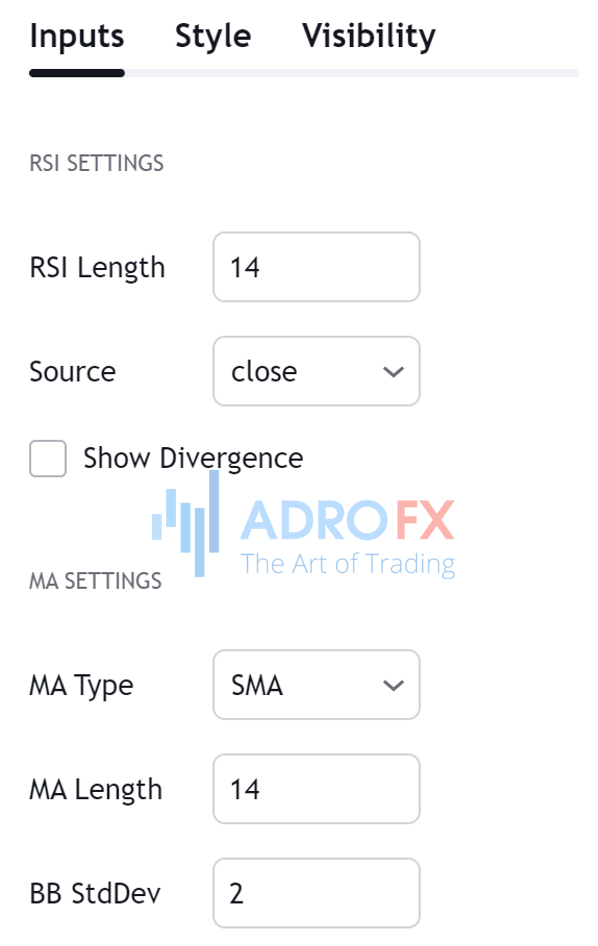
Determining the best settings for the Relative Strength Index (RSI) depends on the specific financial instrument, trading style, and time frame. While there is no universally "best" setting, the default of 14 periods is widely used and serves as a solid starting point. This standard setting calculates the RSI based on the last 14 periods of price data.
However, traders often adjust RSI settings to better align with their individual strategies and preferences. For short-term or intraday trading, a shorter RSI period, such as 9 or 10, may provide more responsive signals for quick trades. Conversely, those with a longer-term outlook might opt for a higher RSI period, like 21 or 25, to filter out short-term fluctuations and focus on broader trends. In volatile markets, a longer RSI period can help smooth out the readings and reduce the incidence of false signals.
a demo account before applying them in live trading. Additionally, the RSI should be used as part of a comprehensive trading approach that includes other indicators, chart patterns, and fundamental analysis.
Remember, no single indicator can guarantee profits, and all trading carries inherent risks. Effective risk management and disciplined trading practices are essential for success, regardless of the RSI settings used.
Trading Strategies Utilizing the Relative Strength Index
The Relative Strength Index (RSI) is a versatile tool in the trader’s arsenal, helping to pinpoint entry and exit points, gauge market momentum, and validate price trends. Here are several popular strategies that leverage the RSI:
Overbought and Oversold Strategy
Buy Signal:
When the RSI dips below the oversold level (commonly set at 30) and then climbs back above it, it may indicate a buying opportunity as the asset could be set for a rebound.
Sell Signal:
Conversely, when the RSI rises above the overbought level (typically 70) and then falls back below it, this might suggest a selling opportunity as the asset could be due for a pullback.
RSI Divergence Strategy
Bullish Divergence:
A bullish divergence occurs when the price makes lower lows while the RSI forms higher lows, signaling a potential reversal to the upside as bearish momentum weakens.
Bearish Divergence:
A bearish divergence happens when the price hits higher highs while the RSI registers lower highs, indicating a possible downside reversal as bullish momentum wanes.
RSI Trendline Strategy
By drawing trendlines on the RSI chart, traders can identify trends and potential reversals. A breakout above a descending RSI trendline or below an ascending one might signal a change in the trend direction.
RSI and Price Trend Confirmation
Combining RSI signals with price trend confirmation can be very effective. For instance, if the RSI indicates oversold conditions while the price is bouncing off a robust support level, it can strengthen a bullish signal.
RSI and Moving Averages
Incorporating moving averages with RSI can help refine signals and confirm trends. For example, a buy signal might be generated when the RSI crosses above a moving average, while a sell signal might occur when it crosses below.
RSI and Support/Resistance Levels
Identifying key support and resistance levels on price charts and observing RSI behavior around these levels can provide crucial insights into potential breakouts or reversals.
These strategies illustrate how the RSI can be a powerful component of a trader's toolkit, enhancing the ability to make informed trading decisions.
Pros and Cons of the RSI Indicator
The Relative Strength Index (RSI) is a popular tool among day traders due to its ability to gauge market momentum and identify potential trading opportunities. However, like any technical indicator, it comes with its strengths and limitations.
Pros:
- Clear Signal for Overbought and Oversold Conditions
The RSI provides straightforward signals regarding overbought and oversold conditions. Values above 70 often indicate an overbought market, suggesting a possible price correction, while values below 30 suggest an oversold market, indicating a potential rebound. This clarity helps traders make quick decisions based on these extremes.
- Effective for Identifying Trend Reversals
The RSI can help pinpoint potential trend reversals by highlighting divergences between the indicator and price trends. For instance, when the RSI diverges from the price direction, it may signal that the current trend is losing strength and a reversal could be imminent.
- Versatility Across Time Frames
The RSI is adaptable to various time frames, whether for short-term day trading or longer-term strategies. Traders can adjust the RSI settings to match their trading style and market conditions, making it a versatile tool for different trading approaches.
- Integration with Other Indicators
The RSI works well in conjunction with other technical indicators and chart patterns. By combining the RSI with tools like moving averages or support and resistance levels, traders can strengthen their trading signals and enhance their decision-making process.
- Helps in Volatility Assessment
The RSI can reflect market volatility, with significant price swings leading to drastic changes in the RSI values. This feature allows traders to gauge the market’s calmness or turbulence, aiding in the adjustment of their trading strategies.
Cons:
- Potential for False Signals
The RSI can sometimes generate false signals, particularly in strongly trending markets. For example, an asset might remain overbought or oversold for extended periods without a significant price correction, leading to misleading trading signals.
- Lagging Nature
As a momentum oscillator, the RSI is inherently a lagging indicator. It is based on past price movements, which means it may react slower to sudden market changes, potentially causing missed opportunities or delayed responses.
- Dependence on Parameter Settings
The effectiveness of the RSI can vary significantly based on the chosen settings. While the default 14-period setting is common, traders may need to experiment with different periods to find the most effective parameters for their specific trading strategy and market conditions.
- Limited Standalone Use
Relying solely on the RSI for trading decisions is risky. The RSI is more effective when used as part of a broader trading strategy that includes other indicators and analysis methods. Its signals should be corroborated with other tools and market analysis to improve reliability.
- Potential Overemphasis on Short-Term Movements
In fast-moving markets, the RSI might focus too heavily on short-term price movements, which can lead to excessive trading or misinterpretation of the market's overall trend. This short-term focus can sometimes overshadow longer-term market dynamics.
In conclusion, while the RSI offers valuable insights into market momentum and potential trading opportunities, it is essential to be aware of its limitations. Using the RSI as part of a comprehensive trading strategy that includes other indicators and sound risk management practices can help mitigate its drawbacks and enhance trading success.
Also read: How To Choose Technical Indicators For Analyzing The Price Fluctuations
Conclusion
In summary, the Relative Strength Index (RSI) is a valuable tool for day traders looking to enhance their trading strategies. By effectively utilizing the RSI to identify market momentum, overbought and oversold conditions, and potential trend reversals, you can make more informed trading decisions. However, it’s essential to remember that the RSI should be used in conjunction with other technical indicators and analysis methods to create a well-rounded trading strategy. Always practice sound risk management and stay adaptable to the evolving market conditions. With these principles in mind, the RSI can significantly contribute to a more successful and rewarding trading experience.
Unlock your trading potential with AdroFx! Use our comprehensive RSI guide to enhance your strategy and start making more informed decisions. Sign up with AdroFx today and apply your RSI knowledge with our advanced trading tools and features. Start trading smarter and achieving better results now!

About AdroFx
Established in 2018, AdroFx is known for its high technology and its ability to deliver high-quality brokerage services in more than 200 countries around the world. AdroFx makes every effort to keep its customers satisfied and to meet all the trading needs of any trader. With the five types of trading accounts, we have all it takes to fit any traders` needs and styles. The company provides access to 115+ trading instruments, including currencies, metals, stocks, and cryptocurrencies, which make it possible to make the most out of trading on the financial markets. Considering all the above, AdroFx is the perfect variant for anyone who doesn't settle for less than the best.
Related Articles

Latest updates
Latest updates


Technical Analysis
Latest updates


