Markets Show Mixed Signals as Tech Stocks Surge While Dow Faces Pressure | Daily Market Analysis

Key events:
- Australia - Building Approvals (MoM) (Nov)
- Australia - Retail Sales (MoM) (Nov)
- Eurozone - Unemployment Rate (Nov)
- USA - Exports
- USA - Imports
- USA - Trade Balance (Nov)
- Canada - Building Permits (MoM) (Nov)
- Canada - Trade Balance (Nov)
Equities surged at the beginning of the trading week, driven by the strength of Big Tech, which lifted the major averages but placed some pressure on the Dow Jones Industrial Average. The S&P 500 experienced a gain of approximately 1.4%, while the tech-centric Nasdaq saw a remarkable surge of 2.2%. This robust performance followed the end of a nine-week winning streak for all three major stock indices on Friday. Concurrently, the Dow recorded a more modest increase of around 0.6%. Monday marked the most substantial single-day gains for the Nasdaq and S&P 500 since November 14.
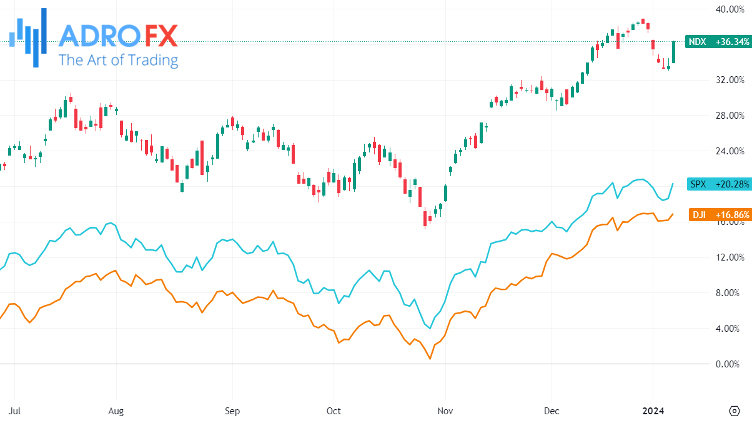
The commencement of the year brought a rocky start for equity markets, with investors choosing to capitalize on profits following an extensive rally in the last two months of 2023. Additionally, anticipation looms ahead of the Q4 earnings season, set to kick off later this week.
According to FactSet, the S&P 500 is projected to witness a year-over-year earnings growth rate of 1.3% for the fourth quarter of 2023. If this estimate holds, it will mark the second consecutive quarter of positive YoY earnings growth for the index.
A lineup of major companies reporting this week includes a cluster of prominent names such as JPMorgan, UnitedHealth, Bank of America, Wells Fargo, Citigroup, BlackRock, and Delta Air Lines, all scheduled to report on Friday.
Meanwhile, shares of aerospace giant Boeing (NYSE: BA) saw a substantial decline on Monday, closing at $226.74, marking an 8.94% drop and reaching the lowest closing price since November 29 of the previous year. This downturn brought an end to a two-day streak of gains for Boeing's stock.
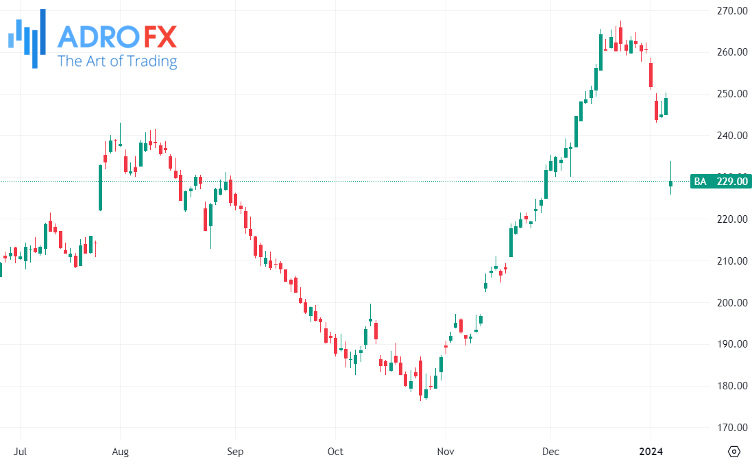
This recent drop led to a 13.01% reduction in Boeing's stock value for both the month-to-date and year-to-date durations. Despite this recent downturn, the company's shares still reflect an increase of more than 8% compared to the same period last year. Furthermore, the current stock price remains substantially higher, by nearly one-third, than the annual low recorded on October 25. Boeing's stock witnessed its most significant intraday decline since October 26, 2022, emerging as the poorest performer within the Dow Jones Industrial Average for the day. The sharp fall in Boeing's shares had a pronounced negative impact on the DJIA.
In the currency markets, the Australian Dollar pared its intraday gains on Tuesday as the US Dollar aimed to rebound from recent losses. Nevertheless, the AUD/USD pair seemed to gain from an enhanced risk appetite, partly driven by remarks from US Federal Reserve members speculating about potential interest rate cuts by the end of 2024. Moreover, positive economic data from Australia, particularly better-than-expected Retail Sales and Building Permits figures for November, provided additional support to the resilience of the Australian Dollar.
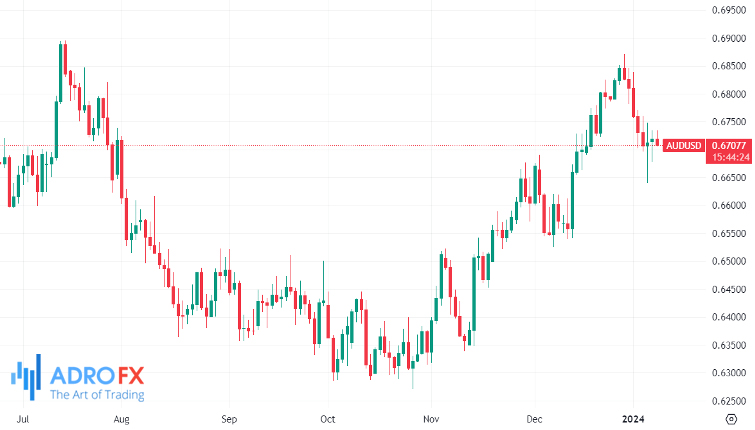
Market participants are eagerly anticipating the release of the Monthly Consumer Price Index data scheduled for Wednesday, which is expected to offer further insights into the Reserve Bank of Australia's interest rate trajectory. Although there are expectations that the RBA will avoid rate cuts in its upcoming February meeting, the influence of economic indicators persists in shaping market sentiments.
Simultaneously, the US Dollar Index confronts challenges amid a decline in US Treasury yields. This, coupled with softer comments from Federal Reserve members, has instigated a risk-on market sentiment, exerting pressure on the US Dollar.
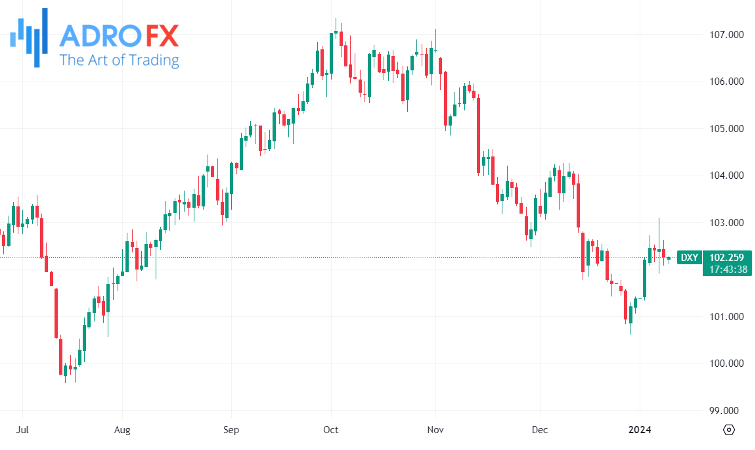
Atlanta Fed President Raphael W. Bostic provided insights into the 2024 economic outlook, noting a more significant decline in inflation than initially anticipated. Bostic expressed the expectation of two quarter-point cuts by the end of 2024, underscoring the importance of allowing the Fed's current policy time to effectively address inflation. He emphasized that the US is on a trajectory toward achieving 2% inflation, to sustain this path.
In the currency markets, the Japanese Yen continued to attract follow-through buying for the second consecutive day on Tuesday. This surge was propelled by data indicating that inflation in Tokyo, Japan's capital city, remains above the Bank of Japan's 2% target. These developments have raised expectations that the central bank might initiate the phasing out of its massive stimulus later this year, potentially bolstering the domestic currency.
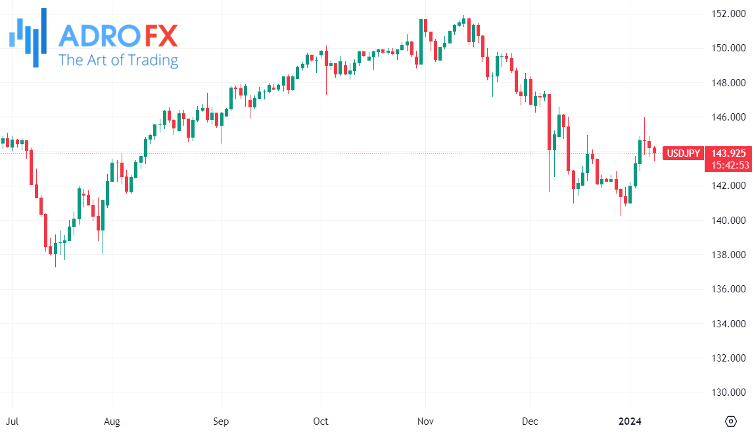
However, government stimulus measures implemented after a New Year's Day earthquake in Japan could have delayed the Bank of Japan's plan to shift away from its ultra-dovish stance. Additionally, a positive tone in Asian equity markets may limit significant appreciation for the safe-haven JPY.
On the other hand, the Canadian Dollar faced downside pressure against major currencies on Monday, influenced by a decline in the Crude Oil market as the second week of 2024 began.
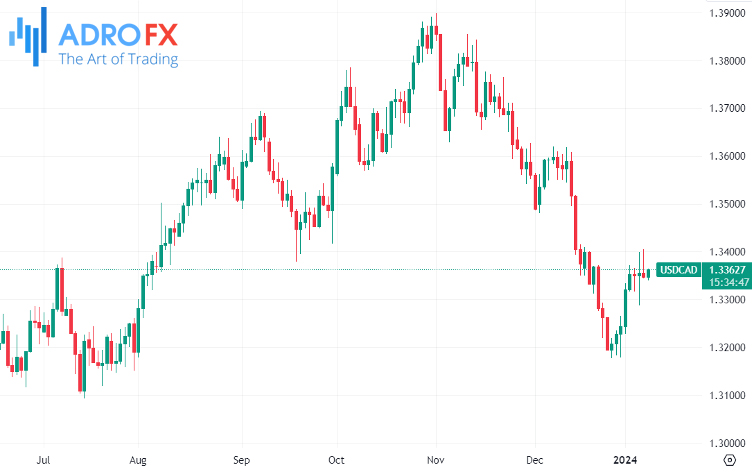
Looking ahead, the economic calendar for the Canadian Dollar features the release of the Canadian International Merchandise Trade Balance and Building Permits, both scheduled for Tuesday. These data points stand out as the sole indicators for the Canadian Dollar this week. The markets are still adjusting following last Friday's US Nonfarm Payrolls report, which underwent substantial revisions to previous periods.
Economic indicators from Canada suggest weakening figures, with the Canadian International Merchandise Trade Balance forecasted to decline from 2.97 billion to 1.8 billion for November. Similarly, Canadian November Building Permits are expected to slip from 2.3% to 2.0%.
Traders may exercise caution and opt to refrain from making aggressive directional bets, choosing instead to await the release of the latest US consumer inflation figures on Thursday. The pivotal US Consumer Price Index (CPI) report could offer clarity on when the Federal Reserve might commence easing its monetary policy, influencing USD price dynamics.
Related Articles


Latest updates
Latest updates


Technical Analysis
Latest updates


