Market Collapse in 2023: Reasons and Prospects
The year 2022 is coming to an end, markets continue their downward movement, the Fed does not cease its hawkish rhetoric... The list of such negative factors could go on for a long time. Perhaps the average investor and trader is not interested in all of this, but something more specific - forecasts, expectations, specific numbers.
As part of our pre-New Year's review, which wraps up this turbulent year of 2022, we will try to share our expectations and thoughts with you.
Technical Picture of the Market
Today we are not just going to look with you at the current technical picture of the SPDR S&P 500 broad market index and other underlying metrics. We are going to use some sort of microscope analogy, and try to zoom in from the daily period to the weekly and then to the monthly. After all, we're talking about an annual forecast, and we're trying to assess the long-run situation.
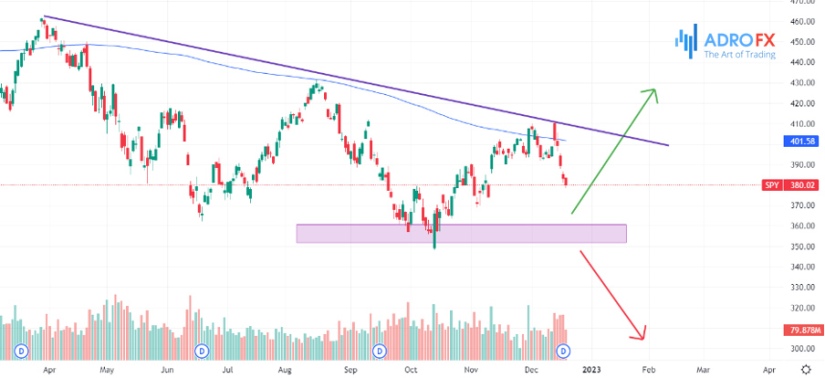
The local picture of the broad market index tells us that a decisive moment in the life of risky instruments has arrived. Yes, that's right, a decisive moment. The fact is that since the beginning of this year, risky instruments are not in great demand - which is understandable, there's no time for casinos, the matter has taken a serious turn.
As a result, we see that the price of SPDR S&P 500 has already been pressed to the level of volumetric support at $364.5 twice. Yes, each time the buyers were able to fight back and they staged small rallies of 12% to 15%, which for the U.S. stock market, such percentages of growth in such short periods of time is decent volatility. Let us remind you that for this market, returns of 10% to 12% per annum are very good.
So, the last meeting of the Fed did not bring us anything good - Powell indicated the same harsh position, both personally and all his colleagues put together. As a result, the market again failed to break out the downtrend on expectations of another decline in consumer inflation - by the time it reached it, it had exhausted the growth reserve. In general, the market is at a crossroads locally, and the results of its participants' choice we will be able to observe on our monitors very soon.
Now we are going to lift above the clouds a little bit and look at the weekly period of the same index.
Looking at this time period, we notice how incredibly familiar the situation in 2008 is with the current one. The similarity is striking, look at the price movements, look at the support/resistance levels, EMA200. Yes, we don't have the sharpest drivers for declines right now - there is no shock to cause such a sharp breakout, everything looks more like a quagmire. But geopolitics is very unstable these days and gives us regular surprises. Who knows what's beyond the event horizon?
And in general, the volumes of trades for resumption of growth from the current price levels look very poor, and again Powell with his endless and accelerating QT, and the key rate by the Fed's plan for the whole year is planned about 5%.
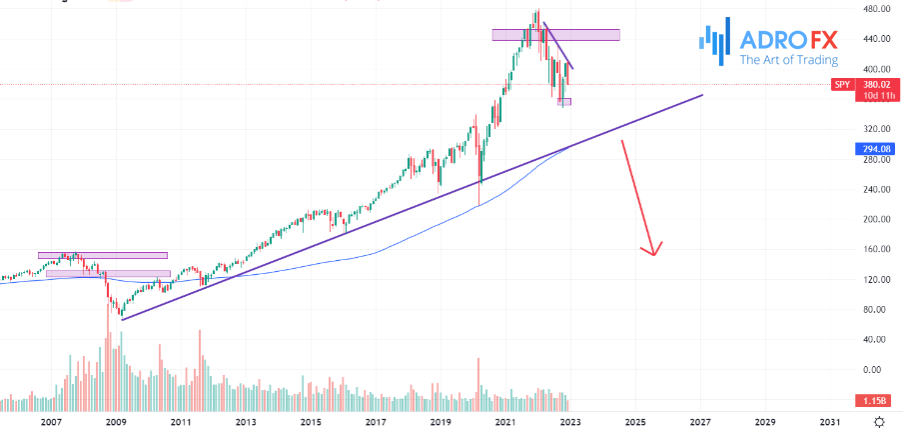
The situation is getting worse somewhat, but that is not all. We rise even higher above all the hustle and bustle into space, and we open up the monthly period.
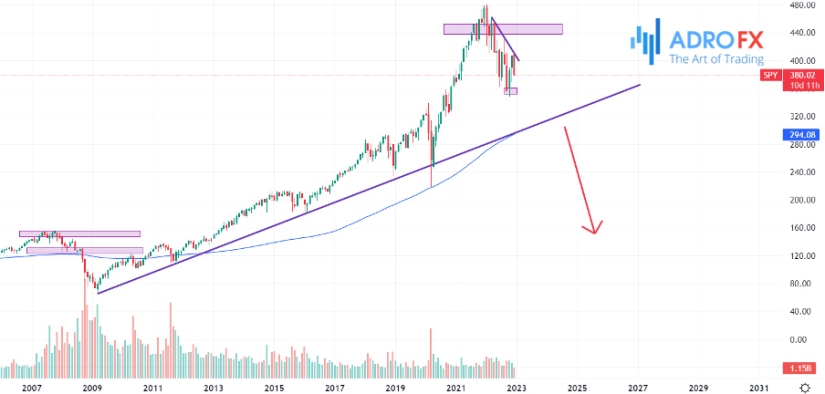
Here we can discern a bit more. The resemblance to 2008 becomes much greater. We can see that during that period, the price of the SPDR S&P 500 broad market index was down 52%, which is where the price has taken its prolonged uptrend for the past 14 years. The previous global up cycle lasted about 16 years, from 1984 to 2000. So, the closest support level that seems possible to hold the price is the $230 level. This level completely corresponds to the usual completeness of the corrective movement both according to the trendline breakout pattern and according to the Fibonacci readings.
The coincidences already seem to be not just coincidences, but just some regularities. But, let's not rush to conclusions, because we have only looked at the technical picture of the broad market index. After all, everything is going to be fine, right?
Fundamental Factors and Indicators
Of course, if we talk about the state of the market, we are talking about risky assets. And if we are talking about risky assets, we are talking about the state of the economy. Everyone knows for a fact that people tend to take risks when the economy is booming, and vice versa, when the economy is feeling very bad, risky assets are under considerable pressure.
And we start looking at the state of the economy with the Treasury yield curve:
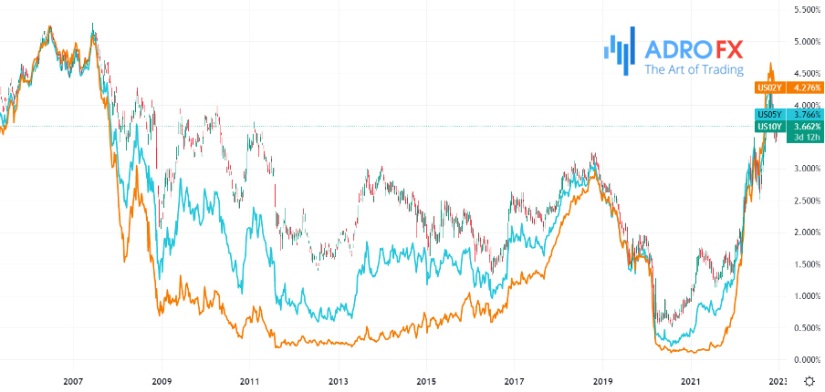
Yes, this very indicator is the harbinger of a recession in the U.S. economy. There's been a lot of talk about it lately. Even Fed Chairman Jerome Powell said at a recent meeting that they were watching this indicator very closely. Well, you can see with the naked eye that the inversion is off the charts - the monthly Treasury yields are much higher than the 10-year yields.
The inversion is so great that it gets a little creepy.
Historically, this was only seen in the 1980's when Paul Walker, at the head of the Federal Reserve, was also relentlessly trashing the American economy by raising the key rate and slashing the monetary balance sheet.
Endless monetary tightening can't just go away for the state of the economy as a whole. Certainly it will reduce GDP growth, which is the main barometer that determines how healthy it is.
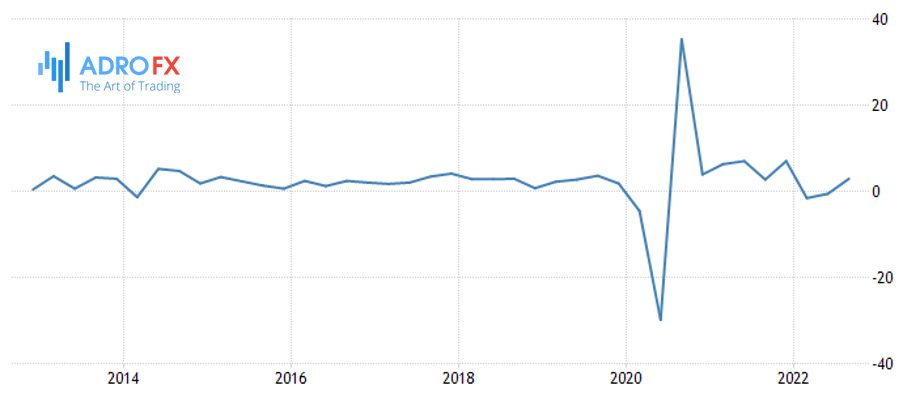
Last year we had the highest level of GDP growth since 1984. This was due to the constant printing of cash, which has unrestrainedly accelerated America's economy. Already this year we can expect GDP growth to slow to 2% or less. The year 2023, given the slowdown in the labor market, consumer purchasing power, housing construction and sales, and more, in general, given the onset of recession, will show us an even greater slowdown in GDP, most likely to 0%.
Exactly the same thing happened back in the 1980's when the GDP growth rate was near 0%, dragging the stock market down into the abyss with the unrestrained growth expectations of the average investor.
Final Thoughts
Risky instruments, as you can already understand from this writing, will not get a significant support in the nearest 2023. It is evident both from the technical picture, which unambiguously hints at the downtrend continuation, and from the fundamental factors, which indicate the bad health of the American economy, and the continuation of the "hawkish" policy of its regulator. One should not bet on growth of the markets "because this indicator right here..." or "because the seasonal indicator right here tells us...". Perhaps this is not the time for such manipulations of facts.
Of course, all is not so sad. Inflationary pressures will steadily decline throughout this year, as the economy itself slows down. It's an understandable fork in the road - economy accelerating = inflation accelerating; economy slowing down = inflation slowing down. In this regard, serious long-term investors will turn their attention to the debt market, which is now in an attractive position to take positions. You need to be buying protective instruments at good prices for the coming risk-on cycle today.
It is likely that gold will also enter the portfolios of long-term investors who are taking care of their capital in advance. In general, there will be a lot of interesting trades for investors, according to the factors described above, and for short-term traders, because for them there will be a decent volatility in the market.

Related Articles

Latest updates
Latest updates


Technical Analysis
Latest updates


