How the CBOE VIX Index Works to Predict Market Volatility
In the ever-changing landscape of financial markets, assessing market volatility and understanding investor sentiment are crucial aspects of making informed investment decisions. The VIX index, also known as the "CBOE Volatility Index" or the "Fear Index," stands as a prominent barometer for precisely these purposes. Created by the Chicago Board Options Exchange (CBOE) in 1993, the VIX has grown into a widely recognized benchmark, offering insights into market risk and uncertainty.
In this article, we delve into the mechanics of the VIX index and explore how it works to predict market volatility. We will uncover the intricacies of its calculation, examine its interpretation, and discover ways it can be used in conjunction with other tools to estimate the future direction of the S&P 500. Moreover, we will explore the various factors that can influence the VIX index and how investors can benefit from understanding its movements.
What Is the VIX Index?
The VIX index, also known as the "CBOE Volatility Index" or simply the "Fear Index," is a popular measure of market volatility and investor sentiment in the United States. It was created by the Chicago Board Options Exchange (CBOE) in 1993 and has since become a widely recognized benchmark for assessing the level of market risk and uncertainty.
The VIX index is calculated using the prices of options on the S&P 500 index. Options are financial derivatives that provide investors with the right, but not the obligation, to buy or sell an underlying asset (such as the S&P 500) at a specific price within a certain time frame. The VIX is specifically based on options with a 30-day maturity.
The VIX index represents the market's expectation of volatility over the next 30 days. It is often referred to as the "Fear Index" because it tends to rise during times of market turbulence, fear, and uncertainty. When investors expect significant price swings in the S&P 500, the VIX tends to increase, indicating higher perceived risk. Conversely, during calmer and more stable market periods, the VIX tends to decline.
Investors and traders use the VIX as a tool to gauge market sentiment, assess risk, and make informed decisions about their investment strategies. A higher VIX reading may indicate that investors are worried about potential market downturns, while a lower VIX suggests a more optimistic and complacent market outlook.
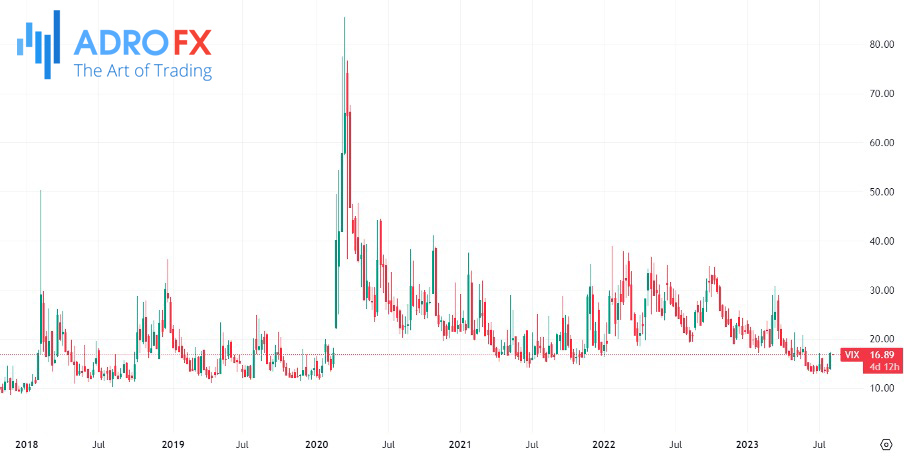
A good example of this is what happened at the start of the Covid-19 pandemic. As shown below, the index rose sharply to a high of $85.63. It was the highest level since 2009:
It's important to note that the VIX index is just one of many indicators used to analyze the financial markets, and it should not be used in isolation to make investment decisions. As with any investment tool, it's crucial to consider various factors and conduct thorough research before making financial choices.
How the VIX Index Is Calculated
The VIX index is calculated using the prices of options on the S&P 500 index. Specifically, it is based on the implied volatility of these options, which is a measure of market participants' expectations for future price fluctuations of the S&P 500 over a 30-day period. The calculation involves several steps:
- Selecting the Options
The CBOE selects a range of out-of-the-money and at-the-money call and put options on the S&P 500. These options should have 30 days until expiration and meet certain liquidity and other criteria to ensure they are representative of the market sentiment.
- Implied Volatility Calculation
For each selected option, the implied volatility is determined. Implied volatility is a parameter derived from the option's market price, and it reflects the market's expectation of the underlying asset's future volatility. In simple terms, it shows how much the market expects the S&P 500 to move in the future.
- Weighting the Implied Volatilities
The next step involves weighting the implied volatilities of the selected options. The weighting is done based on the option's proximity to its expiration date and its distance from the current S&P 500 index price. Closer-to-expiry and more in-the-money options typically have higher weights in the calculation.
- Calculation of the VIX Index
The weighted implied volatilities are then used to calculate the VIX index. The VIX is expressed as an annualized percentage and represents the expected annualized volatility over the next 30 days. To get the VIX value, the calculation multiplies the weighted sum of implied volatilities by a constant factor to arrive at the final index value.
The exact mathematical formula for the VIX index is relatively complex and involves interpolation and extrapolation techniques to account for options with different expiration dates. As of my knowledge cutoff in September 2021, the VIX calculation is updated in real-time throughout the trading day.
How to Interpret the VIX Index
Interpreting the VIX index involves understanding its significance as a measure of market volatility and investor sentiment. Here are some key points to consider when interpreting the VIX:
- Market Volatility
When the VIX is elevated, it suggests that investors are anticipating increased price fluctuations in the S&P 500. A higher VIX value indicates higher expected volatility, which can be associated with potential market downturns or corrections.
- Market Sentiment
The VIX reflects investor sentiment and risk appetite. A low VIX level (usually below 20) indicates a relatively calm and complacent market, suggesting that investors are not overly concerned about potential price swings. Conversely, a high VIX level (usually above 30) suggests heightened investor anxiety and risk aversion, indicating a more uncertain and potentially bearish market outlook.
- Inverse Relationship with the Stock Market
The VIX has an inverse relationship with the stock market. When stock prices decline, the VIX tends to rise, reflecting higher market uncertainty and demand for options protection. Conversely, when stock prices rise, the VIX tends to fall, indicating reduced expectations of future volatility.
- Contrarian Indicator
Some investors use the VIX as a contrarian indicator. Extremely high VIX readings might signal excessive fear and potential market capitulation, suggesting that the market may be approaching a bottom. Conversely, extremely low VIX readings might indicate complacency and euphoria, which could signal a potential market top.
- Short-Term Nature
It's essential to remember that the VIX measures short-term expectations of volatility. It does not provide information about long-term market trends or fundamentals. As a result, it should not be used in isolation to make long-term investment decisions.
- Comparison and Context
When interpreting the VIX, it's helpful to compare its current level to historical values and consider the broader market context. A VIX value of 15 might be high in a market environment where the historical average is around 10, but it might be low during a period when the average is 20.
- Limited Predictive Power
While the VIX can provide valuable insights into market sentiment, it has limitations as a predictive tool. Market dynamics are complex and influenced by numerous factors beyond volatility expectations. As such, relying solely on the VIX for investment decisions is not recommended.
How to Use the VIX to Estimate the Future of the S&P 500
Using the VIX to estimate the future direction of the S&P 500 involves understanding its relationship with market volatility and investor sentiment. While the VIX can provide valuable insights, it is essential to remember that it is not a direct predictor of stock market movements. Here are some ways to use the VIX in conjunction with other tools to gain potential insights into the future of the S&P 500:
- Volatility and Risk Assessment
The VIX reflects market expectations of short-term volatility. A high VIX level suggests that investors expect significant price swings in the S&P 500, indicating increased market risk. Conversely, a low VIX suggests reduced expectations of near-term volatility, potentially signaling a calmer market environment with lower risk. Consider monitoring the VIX to gauge the overall level of risk in the market.
- Contrarian Indicator
As mentioned earlier, the VIX can be used as a contrarian indicator. Extremely high VIX readings may indicate that fear and pessimism are prevalent among investors, possibly signaling an oversold market. In such situations, some investors believe it may present a buying opportunity. Conversely, extremely low VIX readings may indicate complacency and excessive optimism, possibly signaling an overbought market. In this case, it might be prudent to exercise caution.
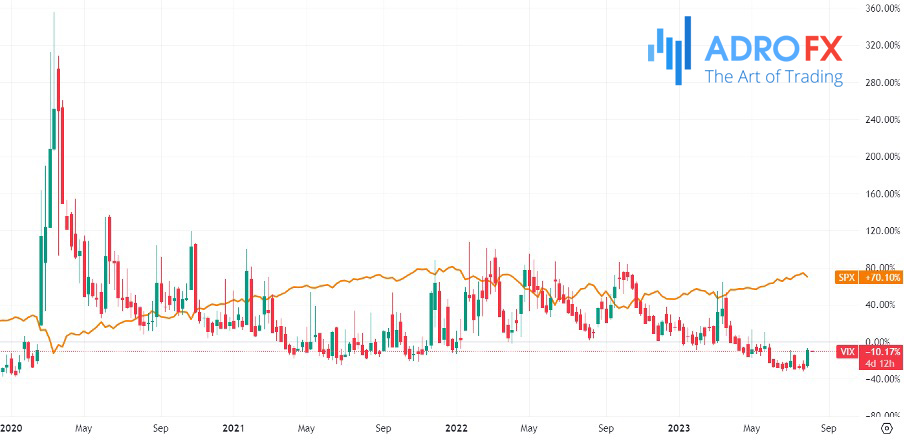
- VIX and S&P 500 Divergence
Pay attention to divergences between the VIX and the S&P 500. For example, if the S&P 500 is rising (bullish), but the VIX remains high or starts to rise, it might signal a potential disconnect between the market's positive momentum and underlying concerns or risks. And the other way around:
- Confirmation with Technical Analysis
Combine VIX analysis with technical analysis of the S&P 500. Technical indicators, chart patterns, and trend analysis can complement VIX's insights to provide a more comprehensive view of the market's potential direction.
- Fundamental Analysis
While the VIX is primarily a sentiment indicator, fundamental analysis remains crucial in assessing the long-term prospects of the S&P 500. Consider analyzing factors like corporate earnings, economic indicators, interest rates, and geopolitical events, as these can have significant impacts on the stock market's direction.
What Moves the VIX Index?
The VIX index is influenced by various factors that affect market sentiment and expectations of future price fluctuations in the S&P 500 index. The VIX moves based on changes in these factors. Some of the key drivers that can move the VIX index include:
- Market Uncertainty and Fear
The primary driver of the VIX is market uncertainty and fear. Investors who are worried about potential market downturns or heightened volatility tend to demand more protection through options contracts. As a result, the prices of S&P 500 options rise, leading to an increase in the VIX.
- Market Volatility
The VIX is designed to measure the expected volatility of the S&P 500: when actual market volatility increases, it often leads to an increase in the VIX as investors expect future volatility to remain elevated.
- Economic Data and Events
Economic indicators, such as GDP growth, employment reports, inflation data, and central bank decisions, can impact the VIX. Weak economic data or unexpected events can lead to higher levels of uncertainty, resulting in a higher VIX.
- Geopolitical Risks
Geopolitical events, such as geopolitical tensions, trade disputes, or political instability, can increase market uncertainty and lead to higher VIX readings.
- Corporate Earnings Announcements
Earnings reports of major companies in the S&P 500 can influence market sentiment and volatility. Disappointing earnings or guidance can lead to higher VIX levels as investors reevaluate their risk exposure.
- Interest Rates and Monetary Policy
Changes in interest rates or monetary policy decisions by central banks, such as the Federal Reserve, can impact market sentiment and the VIX. For example, signals of potential rate hikes may lead to increased market uncertainty.
- Macro Events and Black Swan Events
Unexpected and rare events, often referred to as "black swan" events, can cause significant disruptions in financial markets and lead to a surge in the VIX.
It's important to note that the VIX is a complex index influenced by a combination of factors, and its movements can be challenging to predict with precision. Additionally, the VIX is not directly linked to the performance of the S&P 500; rather, it reflects market expectations of future volatility in the index. As such, it's essential to use the VIX as one of many tools when analyzing the market and making investment decisions.
Conclusion
The VIX index serves as a powerful tool for investors seeking to gauge market volatility and investor sentiment. As financial markets continue to evolve, the VIX will remain an essential component of the investor's toolkit. Its ability to reveal market sentiment and risk appetite will assist investors in navigating turbulent times and making prudent decisions. By embracing the VIX as one of many valuable indicators, investors can enhance their understanding of market dynamics and achieve greater success in their investment endeavors.
About AdroFx
Established in 2018, AdroFx is known for its high technology and its ability to deliver high-quality brokerage services in more than 200 countries around the world. AdroFx makes every effort to keep its customers satisfied and to meet all the trading needs of any trader. With the five types of trading accounts, we have all it takes to fit any traders` needs and styles. The company provides access to 115+ trading instruments, including currencies, metals, stocks, and cryptocurrencies, which make it possible to make the most out of trading on the financial markets. Considering all the above, AdroFx is the perfect variant for anyone who doesn't settle for less than the best.
Related Articles


Latest updates
Latest updates


Technical Analysis
Latest updates


