Crucial Aspects of Market Trends: Techniques for Effective Analysis

Navigating the dynamic terrain of financial markets demands a profound grasp of market dynamics. These dynamics encompass the trajectory of market or asset prices, molded by an intricate interplay of economic, social, and political influences. Analyzing these patterns enables investors to unearth opportunities, mitigate risks, and refine their trading methodologies. This comprehensive manual delves into the essence of market trends - what they signify, how to discern and authenticate them, and their application in both stock and forex markets. Whether you're a novice or a seasoned investor, mastering market trends is pivotal for adeptly navigating financial landscapes and realizing your investment objectives.
Understanding Market Trends: Definition and Significance
Market trends denote the predominant direction in which asset, market, or index prices move over a defined period. Recognizing these trends is imperative for investors and traders alike, guiding timely decisions on asset purchases and sales. Market trends typically fall into three primary classifications:
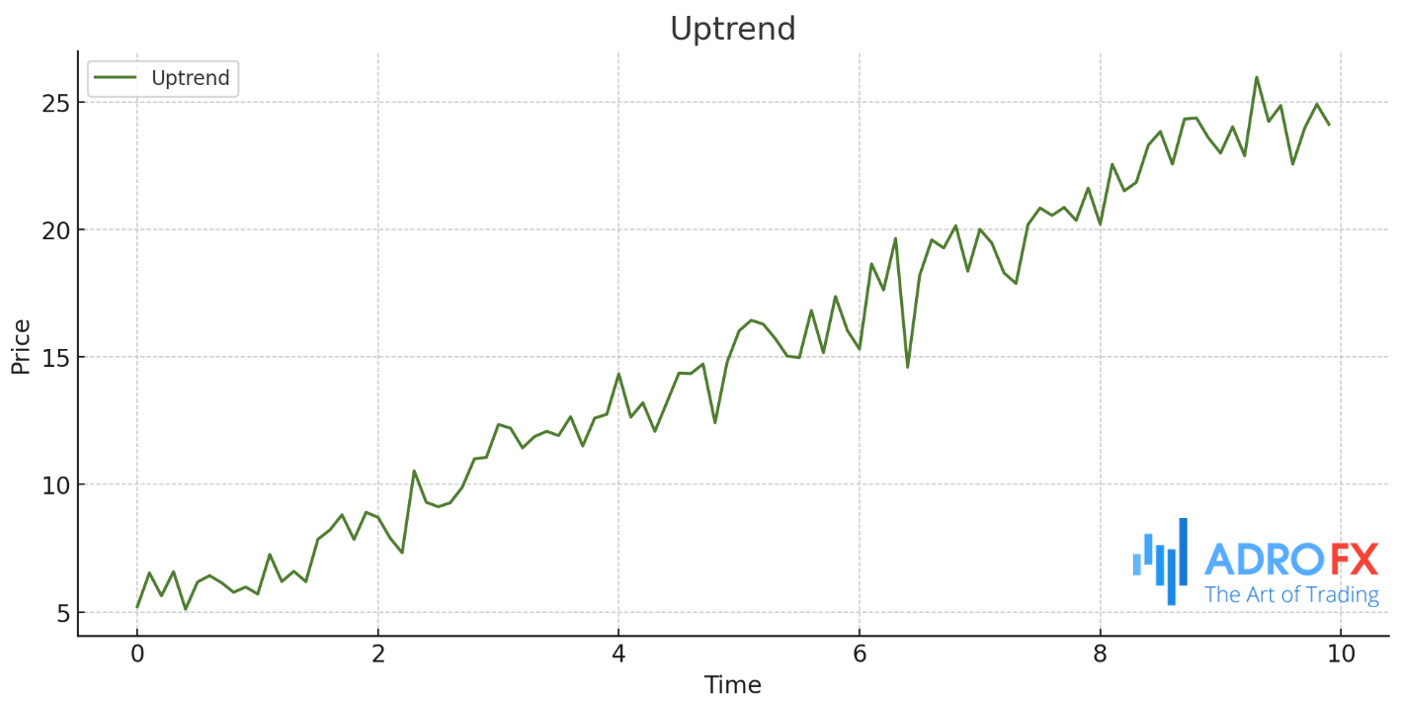
Uptrend
Characterized by ascending asset prices with higher highs and higher lows, an uptrend indicates bullish market sentiment, reflecting investor optimism and increased buying activity.
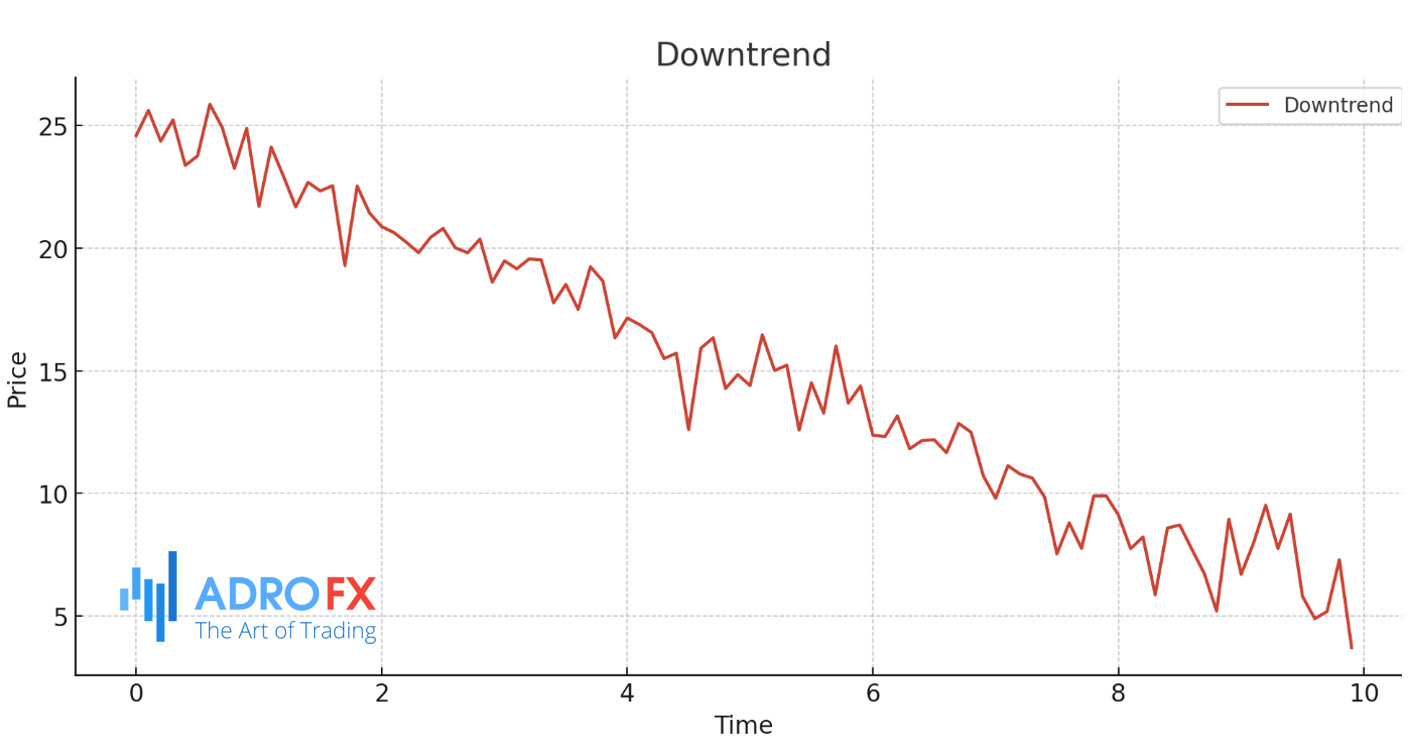
Downtrend
Marked by declining asset prices with lower highs and lower lows, a downtrend signals bearish market sentiment, where pessimism prompts more selling than buying.
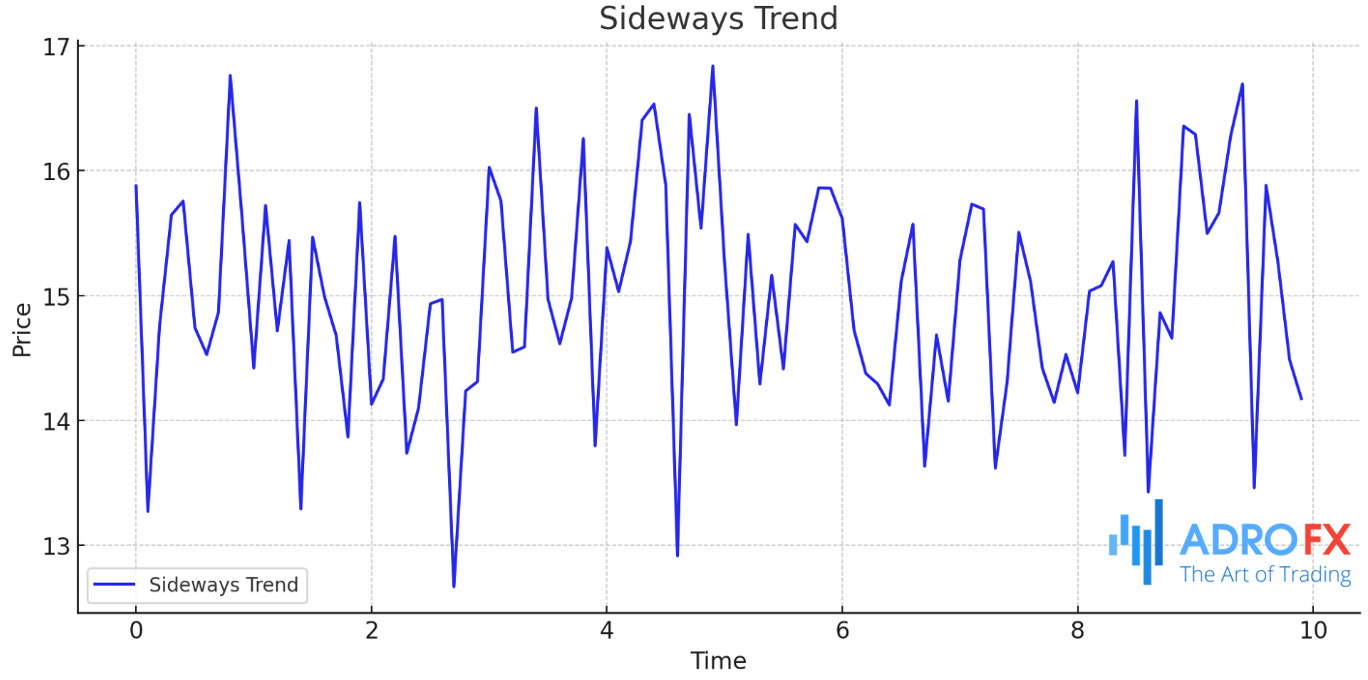
Sideways Trend
Also known as a horizontal trend, this occurs when an asset's price fluctuates within a narrow range without significant upward or downward movement, suggesting an equilibrium between buying and selling pressures.
Understanding market trends is critical as they are propelled by factors such as economic metrics, corporate performance, geopolitical events, and investor sentiment. By discerning these trends, investors can forecast potential market movements and execute well-informed trading strategies.
Analyzing Market Trends
Evaluating market trends involves examining historical price data and other relevant information to predict future price movements. This analysis employs several key methods and tools:
Technical Analysis
Technical analysis revolves around studying past market data, particularly price and volume, to uncover patterns and trends. Essential tools and techniques include:
- Moving Averages
These averages smooth out price data over a specific period, aiding in identifying the trend's direction. For instance, a simple moving average calculates the average price over a set number of days, offering clarity on the trend by filtering out short-term fluctuations. - Trendlines
These lines connect significant price points, such as highs or lows, on a chart. They provide a visual representation of the trend's direction and strength, facilitating the identification of potential reversals or continuations. - Chart Patterns
Patterns like head and shoulders, double tops, and flags offer visual cues regarding potential trend shifts or continuations, indicating whether a trend is likely to persist or change course.
Fundamental Analysis
Fundamental analysis involves evaluating economic indicators, financial statements, and qualitative data to ascertain an asset's intrinsic value. Key considerations in fundamental analysis include:
- Economic Indicators
Metrics such as GDP growth, unemployment rates, and inflation can influence market trends. For instance, robust economic growth can drive an uptrend in stock prices as companies tend to perform better in a thriving economy. - Corporate Performance
Factors like earnings reports, revenue growth, and profit margins provide insights into a company's financial health and future prospects. Investors use these metrics to gauge whether a company's stock is poised to rise or fall. - Geopolitical Events
Events such as political stability, trade policies, and global conflicts can impact investor sentiment and market trends. For instance, political instability may trigger a downtrend as risk-averse investors sell off assets.
Integrating these methodologies offers a comprehensive perspective on market trends. Technical analysis identifies patterns based on past price movements, while fundamental analysis reveals the underlying drivers of these trends. By comprehensively understanding and analyzing market trends, investors can enhance decision-making, effectively manage risks, and increase the likelihood of achieving successful investment outcomes.

What You Should Understand About Market Trends
Comprehending market trends is crucial for successful trading and investing endeavors. These trends vary in duration:
- Short-term trends, lasting from days to weeks, are influenced by immediate market news and events, often characterized by volatile movements.
- Intermediate-term trends span weeks to months, offering a clearer direction by filtering out short-term fluctuations.
- Long-term trends, lasting months to years, are shaped by macroeconomic factors and major market shifts, reflecting broader economic conditions.
Market trends follow distinct phases:
- Accumulation Phase
Informed investors begin purchasing undervalued assets, with prices typically low and market sentiment bearish. - Advancing Phase
Prices rise as more investors recognize the asset's value, fostering a bullish market sentiment. - Distribution Phase
Informed investors start selling as the asset reaches its peak, leading to stabilized or declining prices and mixed market sentiment. - Decline Phase
Increasing selling pressure drives prices down, resulting in a bearish sentiment among investors.
Market sentiment, whether bullish, bearish, or neutral, significantly influences trends and trading decisions. Economic indicators such as GDP growth, corporate earnings reports, interest rate changes, and geopolitical events also play pivotal roles in shaping market trends. Aligning investments with prevailing trends helps manage risks and avoid potential losses by staying in harmony with market movements.
Techniques for Identifying Market Trends
Identifying market trends involves a blend of technical and fundamental analyses:
- Technical Analysis Tools
Essential tools include moving averages (simple or exponential), which smooth price data to reveal trend directions. Trendlines connect highs and lows to visualize trends and predict potential breakout points. The Relative Strength Index (RSI) gauges price movement speed and change, indicating overbought or oversold conditions for potential trend reversals. Bollinger Bands plot volatility levels around moving averages, highlighting potential reversals.
- Chart Patterns
Patterns like head and shoulders, double tops, double bottoms, flags, and pennants provide visual cues for trend reversals or continuations.
- Volume Analysis
Analyzing trading volume confirms trends - increasing volume with price movements signifies strong trends, while decreasing volume may suggest weakening trends or impending reversals.
- Fundamental Analysis
Monitoring economic indicators such as GDP growth, unemployment rates, inflation, corporate earnings, and interest rate changes provides insights into market direction and sentiment.
Staying informed about market news and geopolitical events is critical as they can trigger significant market movements. Sentiment indicators like the VIX measure market volatility and investor fear, often preceding market reversals.
By integrating these methods, investors can effectively identify and analyze market trends, enhancing decision-making and improving their ability to achieve financial goals in dynamic market conditions. Understanding and acting upon market trends are essential skills for navigating the complexities of financial markets successfully.

How to Determine the Validity of a Stock Market Trend
Assessing the validity of a stock market trend is crucial for making well-informed investment decisions. Here are key considerations to determine the validity of a trend:
- Volume Confirmation
A valid trend often exhibits high trading volume. Significant price movements accompanied by increased volume indicate strong investor interest, lending credibility to the trend.
- Trend Duration
The duration of a trend provides insights into its strength and validity. Short-term fluctuations may result from market noise, whereas long-term trends suggest enduring economic or corporate influences.
- Moving Averages
Technical analysts use moving averages to confirm trends. For instance, a stock consistently trading above its 200-day moving average indicates a bullish trend, while trading below signals a bearish trend.
- Support and Resistance Levels
Identifying key support and resistance levels helps validate a trend. A valid trend typically breaks through these levels and continues in the same direction rather than reversing.
- Market Sentiment and News
External factors like economic news and political events influence market sentiment and validate trends. Positive or negative news that aligns with the stock's fundamentals supports the validity of a trend.
- Divergence Analysis
Analyzing divergences between price trends and momentum indicators (e.g., RSI or MACD) reveals potential weaknesses in a trend. A rising price with a falling momentum indicator suggests a weakening trend.
- Pattern Recognition
Recognizing chart patterns such as head and shoulders, double tops and bottoms, and triangles can validate trends. These patterns often precede significant price movements, confirming the trend direction.
By thoroughly analyzing these factors, investors can gain a deeper understanding of whether a stock market trend is valid and make informed decisions accordingly.
Summary
Mastering market trends is essential for investors at every level of experience. Understanding the nature of trends, how to analyze them, and validate their validity are critical steps in making informed trading decisions. By integrating technical analysis, and fundamental analysis, and staying updated on market news and events, investors can enhance their ability to identify and capitalize on market trends.
Whether trading stocks or navigating the forex market, leveraging these insights helps investors navigate the complexities of financial markets and achieve their investment objectives. Continuous learning and staying informed about market conditions are fundamental to developing successful trading and investment strategies.
FAQ on Forex Market Trends
Q: What is a forex market trend?
A: A forex market trend refers to the general direction in which a currency pair moves over a specific period. Trends can be upward (bullish), downward (bearish), or sideways (range-bound).
Q: How can I identify a forex trend?
A: Forex trends can be identified using technical analysis tools such as moving averages, trend lines, and momentum indicators like RSI or MACD. Fundamental analysis, which considers economic indicators and news events, also contributes to identifying trends.
Q: Why is trend duration important in forex trading?
A: Trend duration helps traders assess the strength and reliability of a trend. Long-term trends are generally more dependable than short-term trends, which can be influenced by market noise and volatility.
Q: How does trading volume affect forex trends?
A: Although the forex market lacks a central exchange, trading volume can be gauged through broker data or currency futures. Higher trading volume during a trend indicates strong interest and reinforces the validity of the trend.
Q: What role do economic indicators play in forex trends?
A: Economic indicators such as GDP growth, employment rates, inflation, and central bank policies can significantly impact forex trends. Positive economic data can strengthen a currency, leading to an upward trend, while negative data can weaken it.
Q: How can support and resistance levels assist in forex trend analysis?
A: Support and resistance levels are crucial for identifying entry and exit points within a trend. Breaking above a resistance level suggests a continuation of an upward trend while breaking below a support level indicates a continuation of a downward trend.
Q: What defines a trend reversal in forex trading?
A: A trend reversal occurs when the direction of a trend changes. For instance, an upward trend may reverse to a downward trend or vice versa. Reversals can be identified through chart patterns, divergence indicators, and breaking key support or resistance levels.
Q: Can geopolitical events impact forex trends?
A: Yes, geopolitical events such as elections, trade disputes, and global conflicts can profoundly affect forex trends. Traders must stay informed about global developments as they can cause sudden and significant shifts in currency values.
Q: What role does sentiment analysis play in forex trends?
A: Sentiment analysis involves assessing market sentiment and investor confidence. Tools like the Commitment of Traders (COT) report and sentiment indices provide insights into whether traders are bullish or bearish, helping confirm trends.
By understanding these FAQs, forex traders can navigate the market more effectively, identify valid trends, and make informed trading decisions.

About AdroFx
Established in 2018, AdroFx is known for its high technology and its ability to deliver high-quality brokerage services in more than 200 countries around the world. AdroFx makes every effort to keep its customers satisfied and to meet all the trading needs of any trader. With the five types of trading accounts, we have all it takes to fit any traders` needs and styles. The company provides access to 115+ trading instruments, including currencies, metals, stocks, and cryptocurrencies, which make it possible to make the most out of trading on the financial markets. Considering all the above, AdroFx is the perfect variant for anyone who doesn't settle for less than the best.
Related Articles


Latest updates
Latest updates


Technical Analysis
Latest updates


