Best trading tools for Currency trading - Guide 2021
Trading on any of the markets is quite a complex activity. Unlike other professions, a trader needs to have a computer and a stable Internet connection. It is the minimal set necessary for carrying out activity on the forex market. So why not make trading a little easier by using various Forex instruments for this purpose.
Tools for forex trading are special programs, scripts, informers, techniques, and other ways to get additional information. All that will increase your chances of success and will help to predict the direction of the price. Among them - economic calendar, correlation matrix, forex market heat map, etc. Let's find out what tools for forex trading investors use in their daily routine, why they are needed, and how they help in the process of making trading decisions.
How to find trading opportunities
The most popular tools for forex trading are an economic calendar, a news feed, and technical analysis. Needless to say, it is highly recommended to use them all at the same time, otherwise, there is a risk of losing the whole account because of terrible NFP results (as was expected). Let us have a look at them one by one.
Forex calendars: Economic calendars, news calendars, corporate calendars
The economic calendar is considered one of the most convenient trading tools forex investors can use. It is suitable for traders with any level of training because it does not require any special knowledge. The table clearly describes the factors that must be taken into account to build a competent prediction of price fluctuations. Using this data, the trader will improve his final result and reduce the risk of error.

The forex economic calendar shows macroeconomic indicators in different countries. It announces the scheduled time of publication, the importance of the news, and its impact on the price. With the help of the table presented, the investor will be able to plan his actions in advance and prepare for the event.
Live Forex news: Trading news, live market news, Forex news feeds
By the time you read this short text, there will be several dozen news items around the world. Many of them will have important economic implications, affecting the development of the world financial markets, including the Forex market. Obviously, it is easy to get lost in such a flow of information, and to get the real benefit of it in trading - is a non-trivial task. That's why you should take advantage of the next tool for trades - live forex news.
Making use of the forex news feed trader will be aware of the main events and news of the Forex market before the majority of traders. There you will find the most recent and fresh news daily. Each, even a minor event of the international currency market, is promptly covered in the sources and receives an immediate response from traders. The earlier traders find out about all the changes in the Forex market, the sooner they can make the right decision and trade to their maximum advantage.
Technical analysis for Forex trading

Forex technical analysis is one of the most useful tools for forex trading, so it should not be neglected by both new and experienced traders. All the important components of this analysis should be well studied to successfully apply this knowledge in trading.
First off, technical analysis is a set of charts, showing changes in prices. This type of analysis is quite simple, for example, wave analysis is more complicated. That's why technical analysis is suitable for beginner investors.
The essence of technical analysis is to study the data of past exchange rates and trading volumes and use it as a basis for making forecasts about the changes in currency rates. Charts are built and formulas are used to keep track of changes in currency rates. They also make it possible not to miss the moment to place a successful trade.
Technical analysis takes into consideration both the events that have already happened and those that are only predicted. All factors are taken into consideration in the price change chart. Forex analytics makes use of daily, weekly and monthly technical analysis.
What is the essence of such analysis? Without forecasting the market behavior it's practically impossible to create a strategy of behavior on Forex. A trader must react to changes in the situation quickly, otherwise, he might miss a chance to open a position at a proper time. A prediction made based on technical analysis helps to decide whether it is worthwhile to open a position or not, and how much funds to put into it.
Forex Featured Trading Ideas trading tool
Another useful tool for trades is featured trading ideas. Basically, it is a kind of recommendation provided by a professional trader or by a broker. Usually, it contains a brief description (or detailed), maybe a chart, and the idea itself - buy or sell the underlying asset. Some of the recommendations entail exact entry points and Take-Profit, some just describe the bullish/bearish arguments.
Of course, it can be pretty handy, especially for novice traders or those not willing to spend a lot of time analyzing the market. But before blindly following the lead, make sure to test the ideas offered on the demo account and see if the broker/trader is reliable.
Feeling the market's pulse
Now when we have learned where to find the important news and how to use that information to take advantage of forex trading, we can move to the next type of tools for forex trading. We will give a valuable insight into the reading the market sentiment, as well as the correlation between currency pairs.
Forex market heat map: An at-a-glance view of market movements
The currency heat map displays the ongoing change in currency pair quotes relative to the value of the previous period. The main advantage of the tool is its clarity. Some people find it convenient to analyze a candlestick or bar chart, some people find trend lines convenient, but the heat map is designed for those who prefer analytics in the form of bar charts.
The heat map of currencies shows data in 4 time frames: 30M, 1H, 5H, and D1.
The data is provided only for the eight most popular currency pairs and shows the following changes:
- saturated red hue - the currency pair is lower than the low of the last candle;
- deep green - the currency pair is higher than the last bar's maximum;
- pale red - the pair is lower than the previous candlestick`s close but higher than the minimum;
- pale green - the pair is higher than the previous candlestick`s close but lower than the maximum;
- gray - the currency pair showed a horizontal trend movement (flat).
The accuracy of the heat map signals cannot be called high, because the tool does not display the dynamics of rates, or any numbers, and is partly reminiscent of the signals from the stochastic oscillator. That is why this tool is used in Forex trading only as an auxiliary one (confirming the signals of other indicators).
Forex market sentiment: Who's long, and who's short?
Market sentiment is the attitude of all its participants to the market, which is expressed in the activity and price movements of financial instruments.
If the majority of market participants forecast the emergence of an uptrend, then it is customary to talk about the prevailing bullish sentiment in the market.
If the majority of traders' opinions are in favor of the asset price decrease, then there is a bearish sentiment in the market.
How can the online Forex market mood be determined? There are plenty of ways to quickly and accurately find out the real market mood, for example, dailyfx.com.
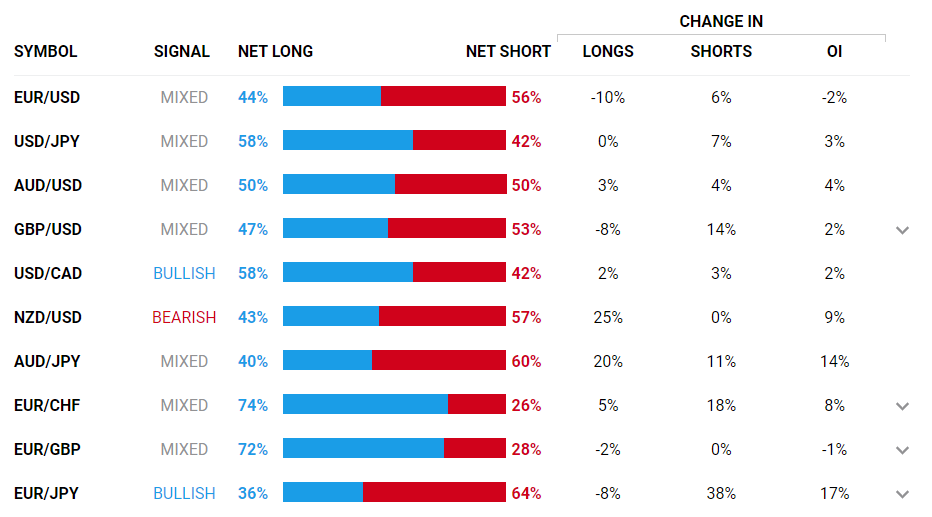
The market sentiment helps a trader not only to estimate the emotional and psychological mood of the other participants but also is a good identifier that allows making accurate short-term and medium-term forecasts.
When the traders' sentiment exceeds the critical historical values for a certain instrument, the probability of the end of this trend increases many times, which must be taken into account when opening a position. The critical values of the sentiment indicators are one of the signals of securing gains by trend positions and preparation of positions for the change of trend.
The information on market sentiment is one of the most vital tools for forex trading when forecasting market behavior and choosing your strategy when placing an order. Market sentiment consists of the moods of its participants, whose positions, in turn, determine the price dynamics.
Forex Correlation Matrix: See which currencies correlate
Traders who are good at math come up with indicators to increase the earnings of their trades. Their technical creations are the work of practitioners. However, even academics have given the world useful statistical tools of the trades.
One of them is the forex correlation matrix.
To make a long story short, correlation is a measure of the degree of relationship between two currencies.
For example, if the correlation coefficient between the currency pairs USD/EUR and USD/GBP is equal to one, it means that they are positively related, i.e. they change their value equally and simultaneously. If it were zero, the pairs would be considered absolutely independent.
In the table or, scientifically speaking, the correlation matrix, forex assets are reflected vertically, and horizontally (on the top) - time frame. In the center, there are values, colored in two colors: blue (negative relation) and red (positive relation). The colors do not convey strength, only the nature of the relationship.
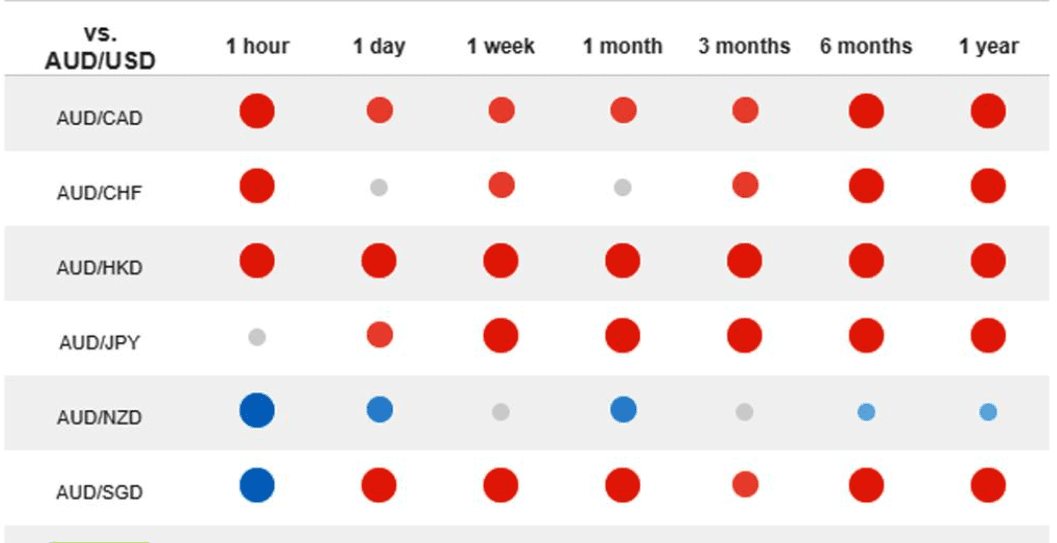
The currency pair is shown at the top left. The correlation coefficient for the currencies placed in the column is calculated in relation to it. The correlation defined in time: from one hour to one year. As we can see, the indicators vary for different time frames, so it is extremely important to clearly understand which period is used for analysis; the market, as it may be, is a fractal phenomenon.
So, how can we use it in practice?
It is enough to study the forex matrix to understand how markets move at different time frames. It is not necessary to read the whole table or memorize it.
Let's take, for example, CHF/JPY and AUD/CAD. The correlation coefficient is 0.83 on a monthly chart. Consequently, there is no sense in trading them over the long term, so you need to choose one or the other.
Unfortunately or fortunately, there will always be a risk, there is no getting away from it. But, using correlation, the trader can decrease it by looking for some regularities in his trading system. For example, you will find out that a successful trade on USD/CAD is followed by a losing one on EUR/USD.
This approach is quite complex and requires a lot of brainwork. In his book "The Mathematics of Money Management", Ralph Vince describes how to correctly apply correlation in the analysis of trade results. No one can explain this idea better than he does, because, in addition to correlation, other mathematical methods are used for completeness of judgments.
Not knowing this technique is not a problem, but mastering it saves a lot of funds on dodging potential losses.
Forex Calculators: How To Calculate Your Trading Gains And Losses
The forex calculator is one of the special programs that simplify the process of getting returns in the financial market. It is designed for managing a trading deposit (capital management).
The program allows you to calculate how many positions and with what volume to enter to achieve the desired trading result. Also, the tool has a lot of useful features and chips, making it an indispensable assistant to forex traders in everyday work.
The program allows calculating: level of risk, point value, level of possible gain and loss, contract volume, Stop-Loss level.
Of course, all these calculations can be done manually, without software, but it takes much more time and effort than using a program.
The advantages of the calculator are obvious:
- high mathematical accuracy;
- speed of calculation, which is important in the process of exchange trading, because the market situation is constantly changing and the decision to open or close a position often have to be made quickly;
- the investor can always quickly see the degree of risk before opening a position and assess its validity.
Keep in mind that it is necessary to compare the data obtained with the latest news, the opinion of forex analysts, and the results of independent technical analysis of forex. Only in this way it is possible to receive high chances of placing successful orders.
Get instant Forex analysis with mini charts
As you know, the biggest inconvenience forex trader faces is the impossibility to monitor several charts of one asset but with several time frames. Consequently, a trader has to click on multiple tabs each time when he wants to double-check the trading idea on the other charts. No doubt, it is irritating and time-consuming.
Mini charts, nonetheless, provide you with the ability to perform technical analysis using different time frames, without switching between the tabs.
It will be handy for scalpers since scalping strategies require a trader to react very quickly to placing trading orders, constantly switching between charts, the trader will lose a decent amount of time, the loss of which is very important for high-frequency trading.
Moreover, opening several windows in the terminal may cause its freezing and "glitches".
Making use of this trading tool, you get the opportunity to monitor the price fluctuations from several angles and, as a result, get a better insight into the market trend.
The option of mini charts is now available on the MetaTrader trading platform, there is no need to download some additional indicators.
Boost trade efficiency with one-click Forex trading
One of the most useful options that can be implemented with the built-in features of MetaTrader 4 is one-click trading.
The very name of this option suggests that it allows you to place orders with just one click of the mouse. Also, it allows you to set Stop-Loss and Take-Profit orders in just a couple of clicks, place pending orders to buy or sell, move an open position to breakeven, and, finally, close a position.
This option is especially important for scalpers trading on small time frames when the speed of opening a position is very important. Before this option appeared in the basic set of MT4 instruments, traders used to search for or write special scripts allowing you to implement one-click trading. Now, as you understand, there is no need to search for such scripts, and everyone can configure this trading mechanism in their terminal.
In order to enable this feature on your trading platform, you should go to Tools -> Options and check the "One Click Trading" box in the Trade" tab. It will open a window with the user agreement, with which you need to agree, and click OK.
Advanced order types for Forex trading
On the basis of advanced orders, such as OCO, trading automation occurs because many orders placed once continue to function in the trading platform.
The OCO order allows traders to place multiple orders simultaneously. When one of them is executed, all remaining orders are automatically canceled. OCO is useful for both opening and closing positions. Perhaps the most popular use of OCO is the bracket order, which places a limit order and a stop order at the same time. When either a stop order or a limit order is executed, the remaining order is automatically canceled. The stop order serves as a protective Stop-Loss in case the trade moves in the wrong direction; the limit order is needed to achieve the target gain. A single OCO order serves as three separate orders: a Stop order (to protect against losses), a Limit order (to close a trade with return), and an Order to close the remaining orders.
Basic or fully automated trading systems can help traders control emotions, avoid costly rookie mistakes and protect open positions with earnings targets, stop orders, and trailing stops.
Forex trading strategy
Finally, we made it to the trading tools forex investors will need to develop and enhance the trading approach. Now we will move to the best ways to spot the trend and will see how to test the trading strategy.
Tools for identifying Forex trends
Trend trading is the key to a successful and beneficial trading strategy. Various tools included in the standard set of any terminal are available to help the trader. One of them is the Moving Average - an indicator determining the trend. The line clearly shows where the price is going to:
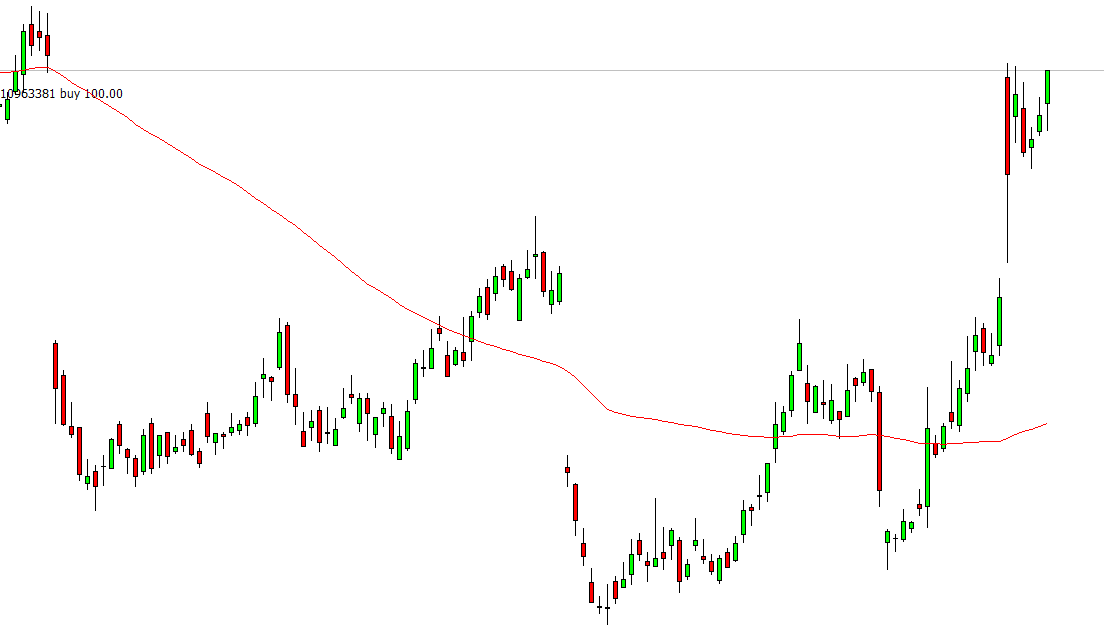
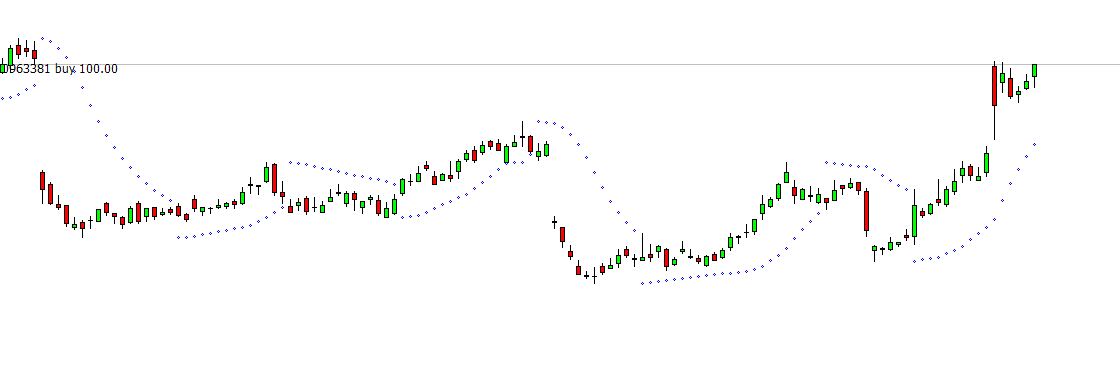
Parabolic SAR is another useful tool. It indicates a "bullish" trend with dots below the candlesticks and a "bearish" trend with dots above the candlesticks:
You might be wondering, which time frame to use to identify the trend?
The answer to this question depends on the trader's strategy and his working time frame. If scalping is practiced at 5-15 minute intervals, it is wise to watch the price on the one-minute chart. But it is always useful to study the picture on higher time frames (M30, H1, D1) to understand the prospects.
Forex trading simulators: Backtest your FX strategies
Only the presence of a well-tuned and backtested trading strategy, allows the trader to expect a stable return. Therefore, the development of such a strategy is the most important stage of a modern trader's work. And full development is inconceivable without adjustment and testing.
MetaTrader 4 allows you to check your strategy in the Strategy Tester. By default, you can use these functions to analyze results and optimize automated strategies (Expert Advisors). To enable the Strategy Tester, simply select "Strategy Tester" from the "View" menu in the upper left-hand corner of your screen or press CTRL+R on your keyboard.
With the Strategy Tester window open, you can select the strategy you are interested in and other parameters related to it. With this, you can optimize your strategy by selecting the right instruments, time frame, and specific conditions of the trade.
Forex Tools: A Summary
In this article, we have highlighted some of the basic tools for forex trading. You can find these tools in the trading platform of your broker you work with, or separately on special sites dedicated to Forex trading.
Successful trading is always a challenge, especially if we are talking about continuous returns. Nevertheless, the tools described can still make trading easier when combined with sufficient training and knowledge of the financial markets.
Related Articles

Latest updates
Latest updates


Technical Analysis
Latest updates


